


Snowflake EXPLAIN command enables you to view the logical execution plan for a SQL query without executing it. You can use it by simply adding the keyword EXPLAIN at the beginning of your SQL statement. Instead of returning the source object’s data as a result, it will return the logical execution plan for the specified SQL statement, giving you details on how Snowflake will execute your query.
In this article, we will cover how Snowflake EXPLAIN works, how to use it with different output formats, how to interpret the query plan, and 5 situations where it can be useful. Let's dive in!
What Does the Snowflake EXPLAIN Command Do?
So what exactly does this Snowflake EXPLAIN command do? Basically, it shows you the logical execution plan for a query without actually running it.
All you need to do is add the “EXPLAIN” keyword at the start of your SQL statement. Instead of getting query results, you'll see a detailed logical execution plan for how Snowflake will execute the query behind the scenes.
Snowflake EXPLAIN compiles the SQL statement and generates an outline of all the operations Snowflake would perform—including scans, joins, filtering, aggregations, and more. This execution plan enables you to understand how Snowflake evaluates the query internally.
The best part is Snowflake EXPLAIN does this without spinning up a warehouse or executing anything. It runs only in the Cloud Services layer, which means it can utilize all the services within the cloud service layers like user authentication, metadata management, access control, query caching, and query parsing & optimization to analyze the plan at minimal cost.
Note: While executing the Snowflake EXPLAIN command does not consume any compute credits since it doesn't run at the warehouse level, the compilation of the query does consume Cloud Services credits, as is the case with other metadata operations.
TLDR; Snowflake EXPLAIN is extremely valuable for analyzing and debugging queries without incurring any usage charges or waiting for results. It gives you the complete query analysis upfront, making it easier to identify bottlenecks.
How to Use Snowflake EXPLAIN?
Using the Snowflake EXPLAIN command is extremely straightforward; simply add the "EXPLAIN" keyword at the beginning of your SQL statement, and that's it. Let's review the syntax and its output formats.
Snowflake EXPLAIN Basic Syntax:
EXPLAIN [USING {TABULAR | JSON | TEXT}] <statement>;The <statement> is the SQL query you want to explain. The optional USING clause specifies the output format.
For Example,
Here is a simple example of using the Snowflake EXPLAIN command, but we will go through a detailed example in a later section.
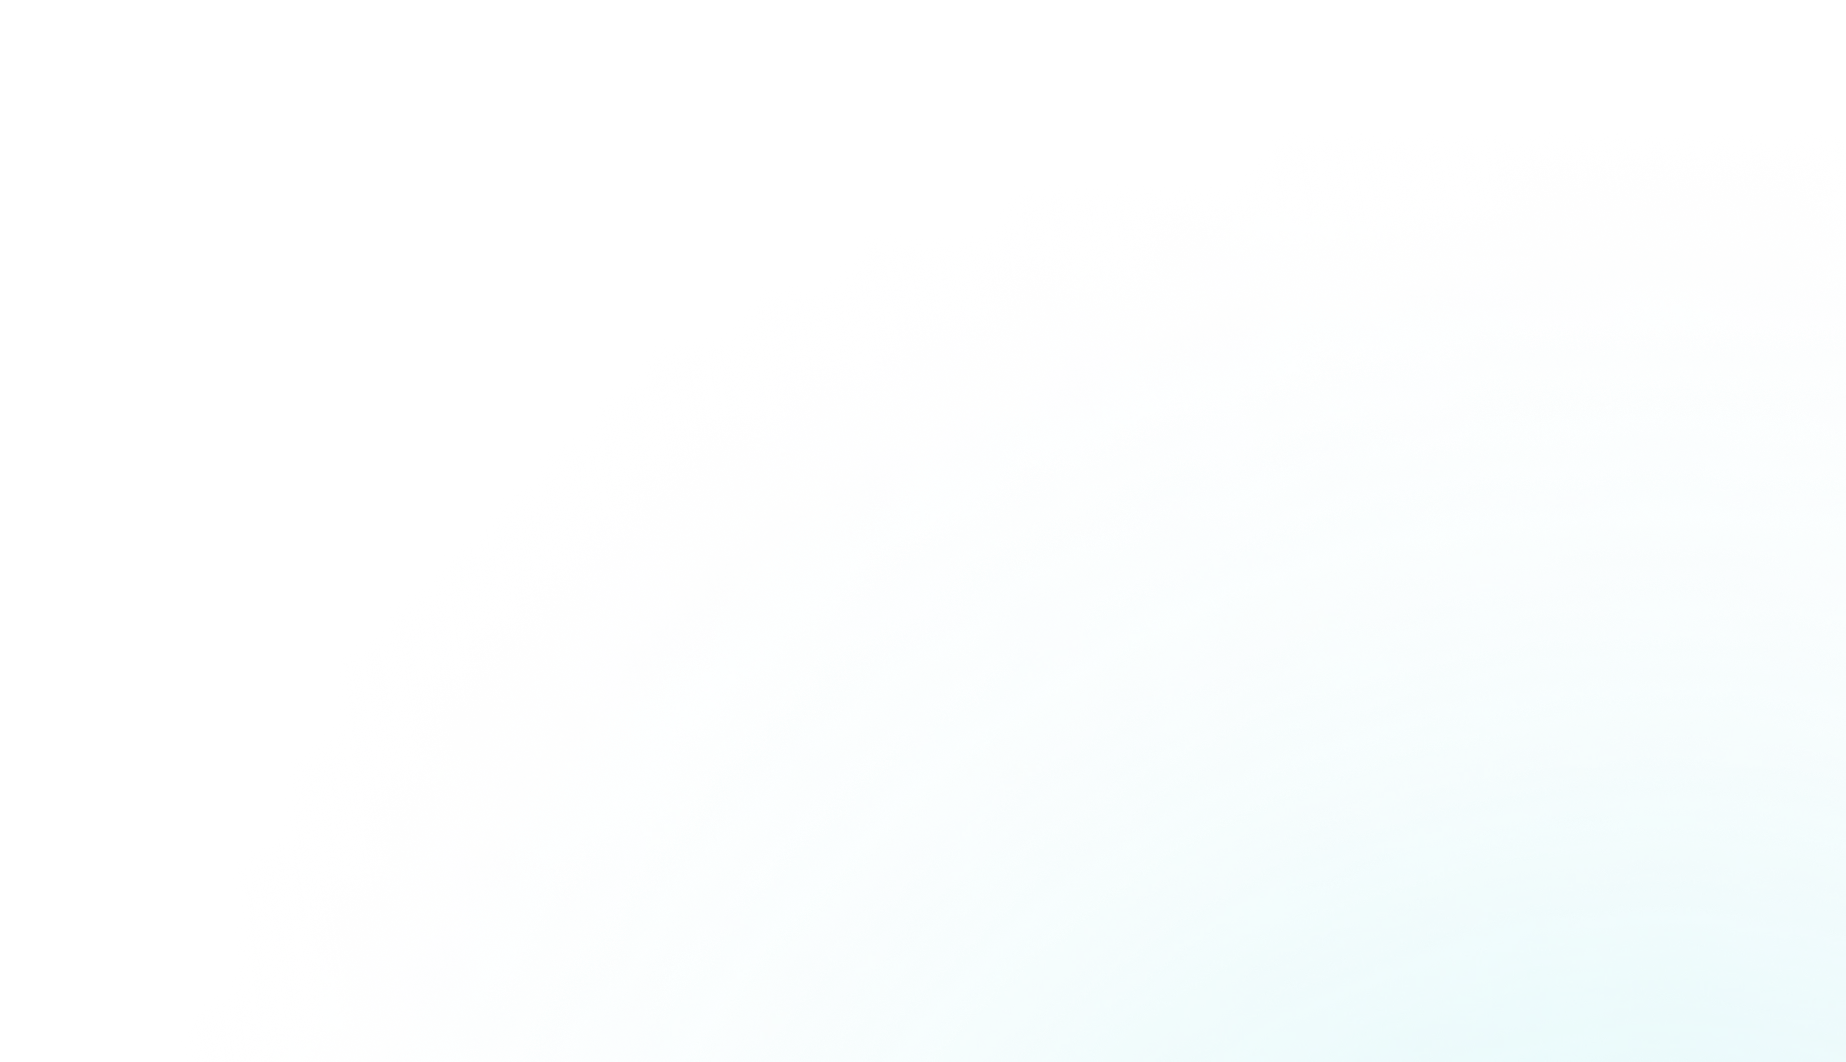
First, create a sample table and insert some data:
CREATE TABLE orders (
  id INTEGER,
  customer_id INTEGER,
  total NUMERIC
);

INSERT INTO orders
  VALUES (1, 123, 99.99),
         (2, 234, 149.99),
         (3, 345, 199.99);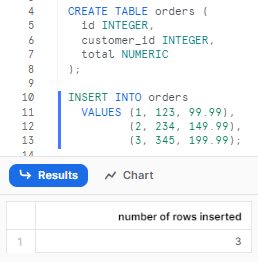
Now let's explain a basic query on this table:
EXPLAIN SELECT *
  FROM orders
 WHERE customer_id = 123;
This would produce a query execution plan like:
As you can see, this shows the filter added, table scan on the orders table, and estimated partitions/bytes to be read.
We can use this plan to optimize the query!
Decoding Snowflake EXPLAIN Output
Now that we have a clear-cut understanding of what Snowflake EXPLAIN is, its syntax, and how to execute it, let's now decode and understand its output.
EXPLAIN command provides detailed output on the logical query execution plan. Let's examine the key columns of information it provides:
- step: Queries may run as multiple steps. This denotes which step an operation is part of.
- id: Unique ID assigned to each operation in the plan.
- parentOperators: IDs of the parent operation this operation connects to.
- operation: The type of operation, like scan, filter, join, etc.
- objects: Tables, views, or materialized views accessed.
- alias: If an object is aliased in the query.
- expressions: Filters, projections, joins, etc relevant to the operation.
- partitionsTotal: Total partitions in the referenced object.
- partitionsAssigned: Estimated partitions left after compile-time pruning.
- bytesAssigned: Estimated bytes to scan based on assigned partitions.
The combination of these columns provides a detailed outline of how Snowflake compiles and plans to execute the query.
Key elements to focus on include the operations, objects accessed, expressions added, and partition/bytes estimates. This information allows for identifying bottlenecks like large table scans and provides metrics for right-size warehouses.
The operations show the logical processing order and relationships between operations., the actual physical execution may be different due to runtime optimizations.
Step-by-Step Guide to Using Snowflake EXPLAIN for Query Analysis
Let's go through a detailed example to see how to use Snowflake EXPLAIN for query performance analysis in Snowflake.
Step 1—Create a sample table and load data
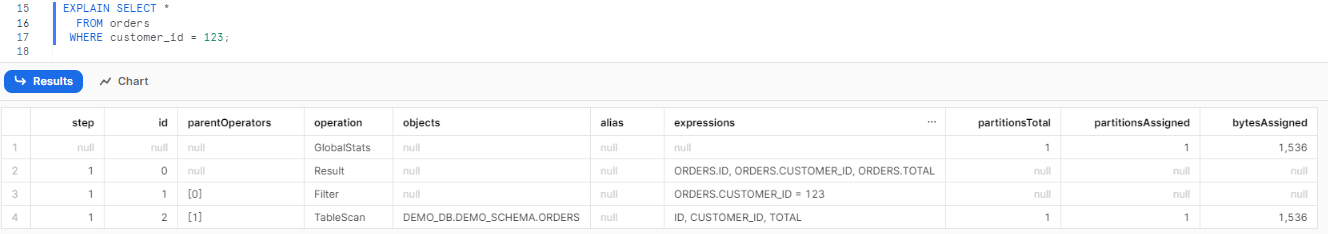
First, we'll create a sample table and load some data:
CREATE TABLE students (
  id INTEGER,
  name VARCHAR,
  gpa DECIMAL(3,2),
  school VARCHAR
);
You can see that this table contains some student records with an id, name, GPA, and school.
Next, we'll insert some sample data:
INSERT INTO students VALUES
  (1, 'Chaos', 3.85, 'Harvard'),
  (2, 'Genius', 3.65, 'Stanford'),
  (3, 'Danny', 3.95, 'Stanford'),
  (4, 'Bobby', 3.45, 'Harvard'),
  (5, 'Helen', 3.15, 'Oxford');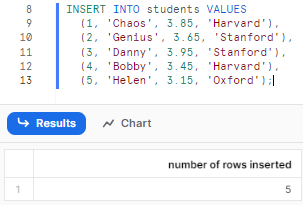
We inserted 5 rows with different school values to test filtering.
Step 2—Write a sample query to analyze
Let's say we want to get student names and GPAs for a specific school:
SELECT name, gpa
FROM students
WHERE school = 'Stanford'
ORDER BY gpa DESC;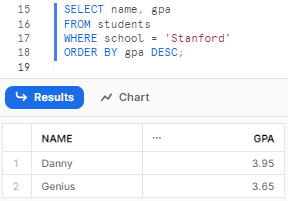
You can see that this query will filter for Stanford and sort by GPA descending.
Step 3—Generate the Snowflake EXPLAIN plan
To analyze this query, all we have to do is add the “EXPLAIN” keyword at the start of the query, and that's it.
EXPLAIN
SELECT name, gpa
FROM students
WHERE school = 'Stanford'
ORDER BY gpa DESC;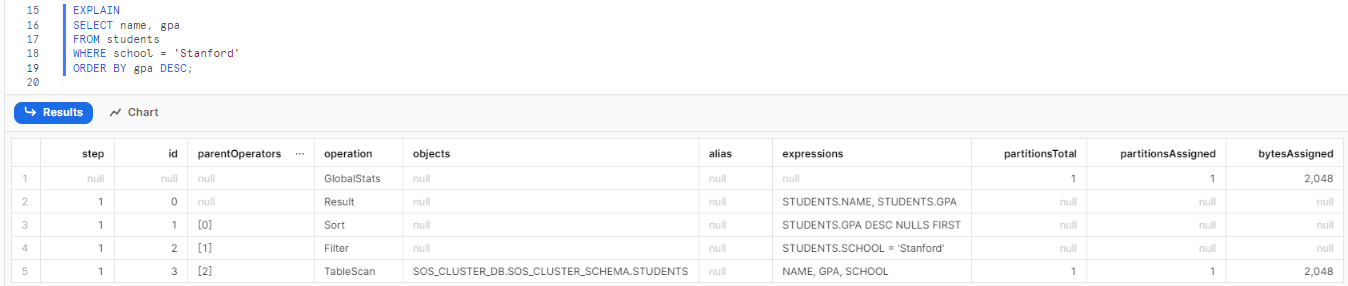
Step 4—View the tabular output
The default <output_format> is tabular:
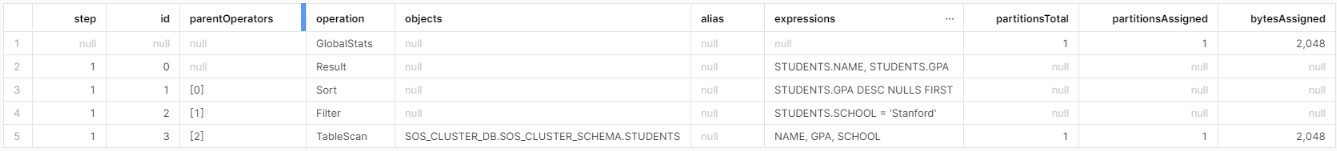
This shows that for “Stanford”:
- A filter will be applied for school = 'Stanford'
- The students table will be scanned fully
- An estimated 2 rows/partitions will be read based on the filter
- Total bytes scanned will be ~2048
- Results will be sorted by GPA DESC
Step 5—View the text output
Next, to view the result in text format, all you have to do is add the “USING TEXT”' parameter after the “EXPLAIN” keyword, and you should get the result in text format.
EXPLAIN USING TEXT
  SELECT name, gpa
    FROM students
  WHERE school = "Stanford"
ORDER BY gpa DESC;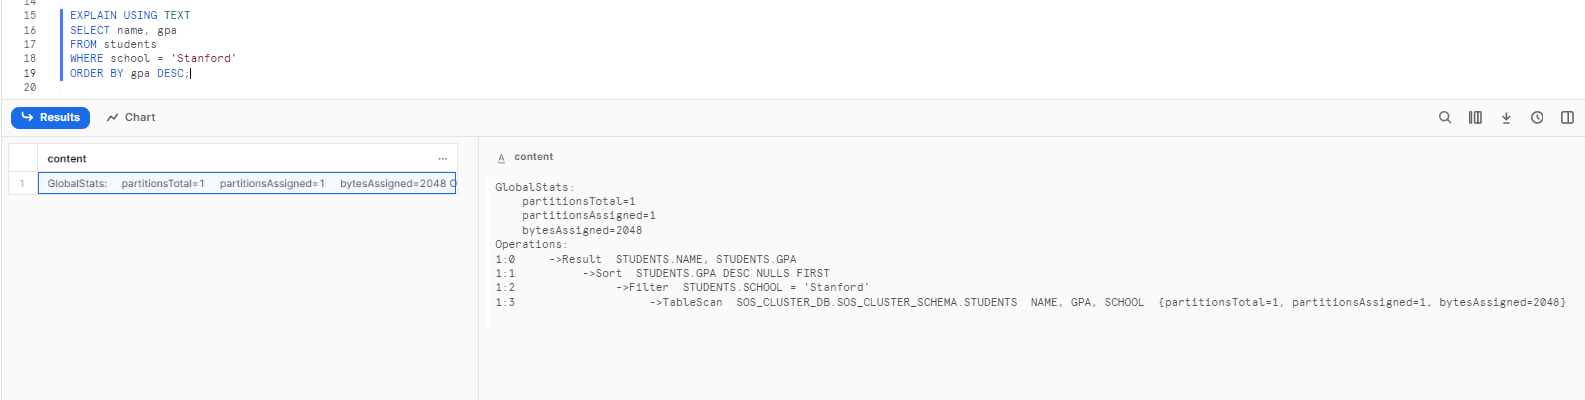
Step 6—View the JSON output
Finally, to view the result in JSON format, all you have to do is add the “USING JSON”' parameter after the “EXPLAIN” keyword, and you should get the result in text format.
EXPLAIN USING JSON
SELECT name, gpa
FROM students
WHERE school = 'Stanford'
ORDER BY gpa DESC;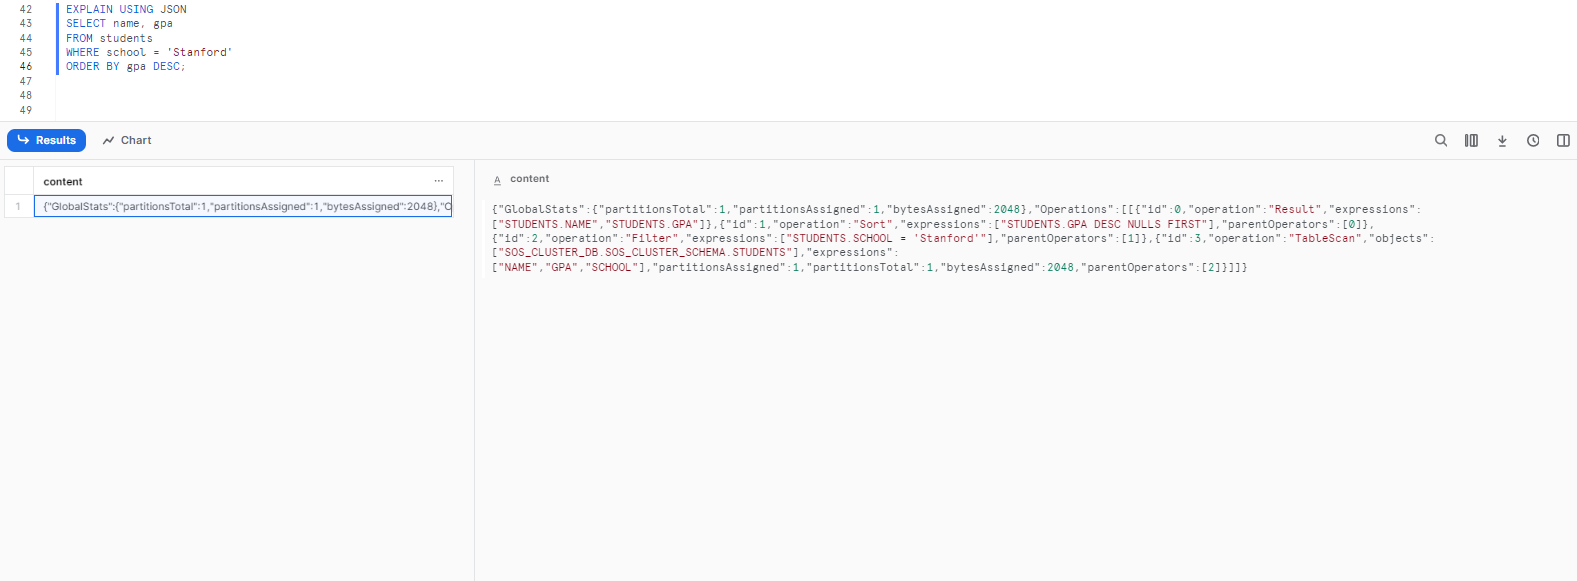
{
  "GlobalStats": {
    "partitionsTotal": 1,
    "partitionsAssigned": 1,
    "bytesAssigned": 2048
  },
  "Operations": [
    [
      {
        "id": 0,
        "operation": "Result",
        "expressions": [
          "STUDENTS.NAME",
          "STUDENTS.GPA"
        ]
      },
      {
        "id": 1,
        "operation": "Sort",
        "expressions": [
          "STUDENTS.GPA DESC NULLS FIRST"
        ],
        "parentOperators": [
          0
        ]
      },
      {
        "id": 2,
        "operation": "Filter",
        "expressions": [
          "STUDENTS.SCHOOL = 'Stanford'"
        ],
        "parentOperators": [
          1
        ]
      },
      {
        "id": 3,
        "operation": "TableScan",
        "objects": [
          "SOS_CLUSTER_DB.SOS_CLUSTER_SCHEMA.STUDENTS"
        ],
        "expressions": [
          "NAME",
          "GPA",
          "SCHOOL"
        ],
        "partitionsAssigned": 1,
        "partitionsTotal": 1,
        "bytesAssigned": 2048,
        "parentOperators": [
          2
        ]
      }
    ]
  ]
}
Step 7—Analyze the plan to identify optimizations
So by reviewing the EXPLAIN plan, we can gain several performance insights before even executing the query:
- A full table scan is happening — we could reduce this by adding an index on school.
- 2 rows are estimated to be read — we could right-size to a smaller warehouse for this query.
- Sorting is being done — we could avoid this by querying in gpa order.
As you can see, we can get these insights just by analyzing the Snowflake EXPLAIN plan, instead of needing to execute test queries and observe actual performance. This allows optimizing queries before deployment, and debugging issues without impacting production workloads.
5 Situations Where Snowflake EXPLAIN Can Be Useful
Snowflake EXPLAIN can be valuable in many scenarios like:
1) Troubleshooting/Fixing Slow Queries
When a query is suddenly dragging or costing you a ton, Snowflake EXPLAIN is super useful. It shows you how Snowflake executes the query step-by-step. You can make use of the Snowflake EXPLAIN command to look at the number of partitions scanned and bytes read to identify operations reading large chunks of unwanted data. If the plan shows a scan reading 50 million rows when you only expect 50, that's a sign something needs optimization like adding filters or improving join logic.
So, with the help of in-depth insights from Snowflake EXPLAIN, you can rewrite the problematic query to be more performant. You'll know exactly which parts of the execution plan to target. Snowflake EXPLAIN gives you the information needed to make tuning and rewriting decisions to drastically speed up the query and drastically reduce compute costs.
2) Testing and improving new complex queries
Whenever you are writing a new complex query, Snowflake EXPLAIN allows you to iterate and refine the query without needing to fully execute the whole thing each time. Way faster. This is extremely beneficial for long-running queries.
You can run Snowflake EXPLAIN as you build the query to validate the logic and flow. Each tweak and addition can be EXPLAINed to confirm you are optimizing the execution plan with every change, like testing different join paths, filtering approaches, etc, and comparing query explanations to see which is most efficient.
This query-building process is much faster with Snowflake EXPLAIN than executing the full query after each change, especially on large data sets.
3) Peeking under the hood to see how queries run
Even for simpler queries, Snowflake EXPLAIN gives insight into how Snowflake will execute it under the hood.
The explain plan visually shows the query operations and order in an easy-to-understand way. You can quickly see if a join will happen before or after a filter, if operations leverage partitioning, partitions assigned, bytes assigned, etc.
For data engineers, developers, and analysts less familiar with query optimization and execution, Snowflake EXPLAIN provides a simple way to pull back the curtain and really understand how their SQL code is run by the Snowflake optimizer.
The info gained from reading EXPLAIN plans can help progress skills and sophistication in writing performant Snowflake queries. You can learn how different query design choices impact performance based on the explain plans.
4) Share explain plans for discussion and collaboration
Snowflake EXPLAIN provides a common point of reference for discussions about query optimization and debugging.
Instead of vaguely discussing a slow query, you can share the precise explain plan with other engineers, developers, or analysts to gather their insights.
The output of a Snowflake EXPLAIN plan concisely captures all the important details of query execution in a tabular, text, or JSON format that is easy to read. This is much simpler than sharing extensive query logs or describing the issues verbally.
You can share the Snowflake EXPLAIN plan in a JSON format, which can be included in documents, or you can upload it to tables to facilitate the analysis and discussion of Explain plans. Also, the JSON format allows for the creation of tools and visualizations to gain further insights from explain plans.
5) Tracking query performance over time
Periodically run Snowflake EXPLAIN on your common queries and save the plans. This allows you to monitor performance changes over time as the data evolves. Comparing the explain plans over time helps identify any performance degradation.
You will be able to detect if changes in the data have led to less effective partition pruning, an increase in the number of partitions scanned, or more skewed performance. Significant discrepancies may indicate a need to optimize the query logic or the data layout for better performance.
Storing actual explain plans also enables you to track the improvements resulting from optimization efforts. You can clearly demonstrate the effectiveness of your tuning by comparing metrics, such as the number of partitions scanned before and after optimizations. With the help of Snowflake explain plan history, you can easily gain visibility into query regressions and progress over the long term.
Bonus—Analyzing materialized views without running queries
You can utilize a Materialized View in Snowflake without directly mentioning it in your queries. Instead, you can rely on the optimizer to automatically employ the materialized view when it offers a more efficient route to executing the query.
To confirm whether the materialized view is being used in this scenario, run Snowflake EXPLAIN on the query. The Snowflake EXPLAIN plan will reveal whether the optimizer is selecting the materialized view or opting for a different query path.
Using Snowflake EXPLAIN, as opposed to executing the complete query, allows you to test the materialized view's usage without incurring extra resources and credits. This approach provides insight into whether the optimizer is taking advantage of the materialized view as anticipated, without the full cost of executing the query.
Bonus—Testing object existence/accessibility
Checking if an object exists, is accessible, or if the syntax is valid often involves executing a query against it. But running the query can incur overhead like spinning up a virtual warehouse.
Instead, use Snowflake EXPLAIN—it will parse the SQL syntax and resolve objects without actually running the full query. For example:
EXPLAIN SELECT * FROM non_existent_table;
EXPLAIN SELECT * FROM secure_view_i_cant_access;
If EXPLAIN fails with an error, it means the object doesn't exist or you lack privileges. If it succeeds, you know the object is accessible with valid syntax. Snowflake EXPLAIN lets you efficiently test these conditions.
Difference between Snowflake EXPLAIN and Snowflake QUERY PROFILE
Here's a detailed comparison between Snowflake EXPLAIN and Snowflake Query Profile:
| Snowflake EXPLAIN | Snowflake QUERY PROFILE |
| Snowflake EXPLAIN provides the logical execution plan for a SQL statement without actually executing the query | It's generated after the execution of a query, providing a comprehensive report of the query's performance |
| Snowflake EXPLAIN shows the operations that Snowflake would perform to execute the query, like table scans and joins | The Query Profile includes runtime statistics, execution details, and resource usage |
| Snowflake EXPLAIN is used before query execution to optimize and understand how the query will be processed | It details the actual execution by showing how many rows are processed at each stage and the time it took |
| Output formats include JSON, tabular, or text | It helps in post-execution analysis by identifying bottlenecks and areas for performance improvement |
| It helps in optimizing the query by giving insights into partitions and bytes that might be scanned | Query profile also reports errors or warnings that occurred during query execution, which can be useful for troubleshooting |
Conclusion
Snowflake EXPLAIN command is an extremely valuable tool for looking under the query's hood. It allows you to view the logical execution plan of your query, enabling you to analyze and optimize queries before executing them fully. The insights gained can save considerable time, resources, and costs.
In this article, we covered:
- How Snowflake EXPLAIN works?
- Step-by-step guide to using Snowflake EXPLAIN for query analysis
- Decoding and interpreting the Snowflake EXPLAIN query plan
- 5 situations where EXPLAIN can be useful
Snowflake EXPLAIN is like a cookbook preview, showing you the recipe steps before you start cooking, so you can see how your meal—or in this case, your query—will come together.
FAQs
Does using Snowflake EXPLAIN consume compute credits?
No, Snowflake EXPLAIN does not use any compute because it does not execute the query. But it does use a small amount of Cloud Services credits like other metadata operations.
What are the output formats for Snowflake EXPLAIN?
Snowflake EXPLAIN can output the query plan in tabular, text, or JSON format. JSON is best for storing plans.
What information does the Snowflake EXPLAIN plan contain?
It shows the operations, objects accessed, expressions, total/assigned partitions, assigned bytes, and more. This provides insight into how the query will execute.
When would Snowflake EXPLAIN be useful for query analysis?
EXPLAIN is extremely valuable for analyzing slow queries, testing complex queries during development, analyzing materialized views, testing object existence/accessibility, and tracking query performance.
Can Snowflake EXPLAIN help share plans to collaborate?
Yes, the EXPLAIN output provides an easy way to share query details and execution plans with others to discuss optimizations.
How can you track query regressions with Snowflake EXPLAIN?
Saving historical EXPLAIN plans allows comparing metrics over time to identify performance regressions as data changes.
Can Snowflake EXPLAIN test materialized view usage?
Yes, Snowflake EXPLAIN shows if a materialized view is used by the optimizer without executing the full query.
Does Snowflake EXPLAIN guarantee the runtime plan matches the explain plan?
No, the explain plan shows logical operations but the runtime plan may differ due to optimizations.
Can Snowflake EXPLAIN check if an object exists without accessing it?
Yes, EXPLAIN will error if an object is missing so it can efficiently test existence.
What are some key metrics to check in a Snowflake EXPLAIN plan?
Important metrics are total partitions, assigned partitions, assigned bytes, operations, and expressions to analyze.
Can Snowflake EXPLAIN compare plans for different query versions?
Yes, comparing EXPLAIN plans side-by-side helps choose the most optimal query approach.
What are some alternatives to using Snowflake EXPLAIN?
Other options are running and analyzing SHOW QUERY Profile, but that executes queries and incurs charges.
Is Snowflake EXPLAIN supported in Snowflake Web-UI(Snowsight) or Worksheets?
Yes, Snowflake EXPLAIN can be run and analyzed right within the Snowflake web interface or Worksheets.