


Data is the new oil; like oil, it must be processed to reveal its true value. Businesses that know this have embraced the power of data warehousing platforms such as Snowflake. Snowflake has increased in popularity due to its ability to store and analyze enormous amounts of data in real-time. Yet, as the volume of data expands, so does the difficulty of querying and analyzing that data. This is exactly where Snowflake query optimization comes in.
Snowflake query optimization is all about streamlining queries for optimal performance. It entails a series of techniques and practices to speed up query execution, economize resources, and reduce data warehouse costs. In this article, we'll look at the importance of Snowflake query optimization and how to use a Snowflake Query Profile to achieve optimal results and successful Snowflake query optimization.
What is Snowflake Query Profile?
Snowflake Query Profile is a feature of Snowflake that provides a comprehensive report and insight into the Snowflake query optimization and execution. This automated profile is generated after every execution of the query, giving you an array of different metrics and statistics to gain a further understanding of your query’s performance. With these details, users can evaluate their query to understand execution time better and pinpoint key areas for Snowflake query optimization.
Some key features of a Snowflake Query Profile are:
- Query runtime stats: Snowflake Query Profile provides users insight into how their query executes. It offers detailed stats and information about the start and end times, total duration, and data scanned to give an in-depth understanding of what is happening behind the scenes of a SQL query. This ensures that queries are being processed as efficiently as possible.
- Query execution stats: Snowflake Query Profile provides detailed insights about a query's execution. It outlines the various stages of the query plan, including the number of rows processed at each stage and how long it took to complete. This information can assist users in understanding how their query was handled and help them to identify any potential issues or key areas for Snowflake query optimization.
- Query resource usage: Snowflake Query Profile gives users insights into the resources used to execute their queries. CPU processing and disk I/O (local disk and remote disk) are all monitored, allowing users to make data warehouse configuration adjustments meant to avoid resource bottlenecks and optimize query performance.
- Query error/warning messages: Snowflake Query Profile provides insight into your query’s execution by providing information such as query details and performance metrics, as well as any errors or warnings occurred during the query execution. With the help of this data, users can refine their query structure to improve performance and troubleshoot issues that arise.
Want to take Chaos Genius for a spin?
It takes less than 5 minutes.

How to Use Snowflake Query Profile?
To deal with slow and expensive Snowflake queries, you need to understand the essentials of the Snowflake query profile. With the query profile, you'll be able to find and resolve potential bottlenecks in your query's execution. The query profile functions as a window into the "black box" of Snowflake and provides a breakdown of how it translates a given SQL query into an operational data pipeline. Fortunately, if a query takes longer than expected, the Snowflake query profile can expose the key elements contributing to its slowness. The Snowflake query profile offers an in-depth preview of the configurations and performance metrics associated with the executed operation and can be accessed in a variety of ways, such as:
Accessing Snowflake Query Profile with Snowsight
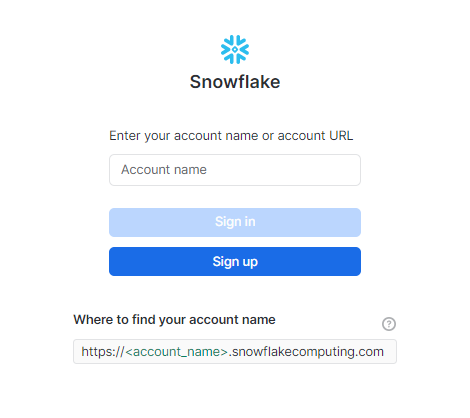
Step 1: Log in to your Snowflake Snowsight console.
Step 2: Select the "Activity" option from the left navigation panel.
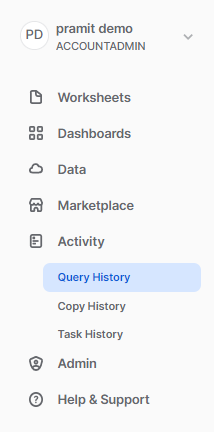
Step 3: Within the "Activity" section, click the "Query History" option.

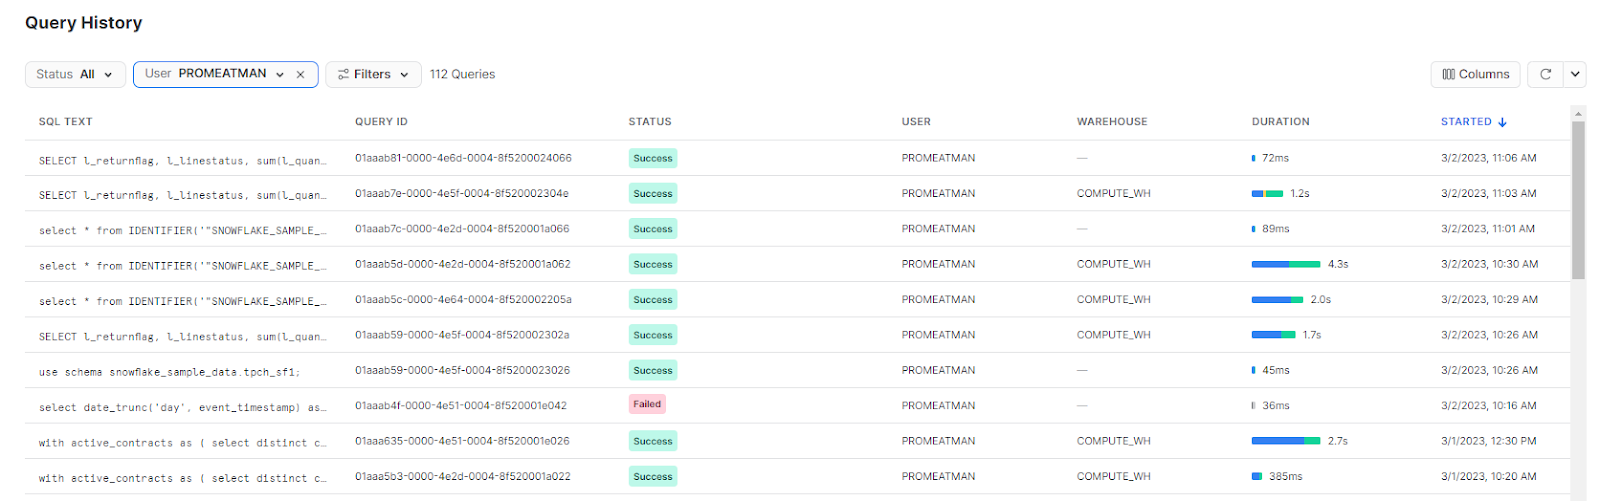
Step 4: Locate the query you want to analyze and click on it.
Step 5: After selecting the query, you will see an option to access the query profile. Click on "Query Profile."
The Snowflake query profile will display a comprehensive breakdown of the query's performance, including execution time, resource usage and data pipeline information.
Accessing Snowflake Query Profile with Classic UI
Step 1: Log in to your Snowflake account and open the Classic UI.
Step 2: Select the "History" option from the top menu.
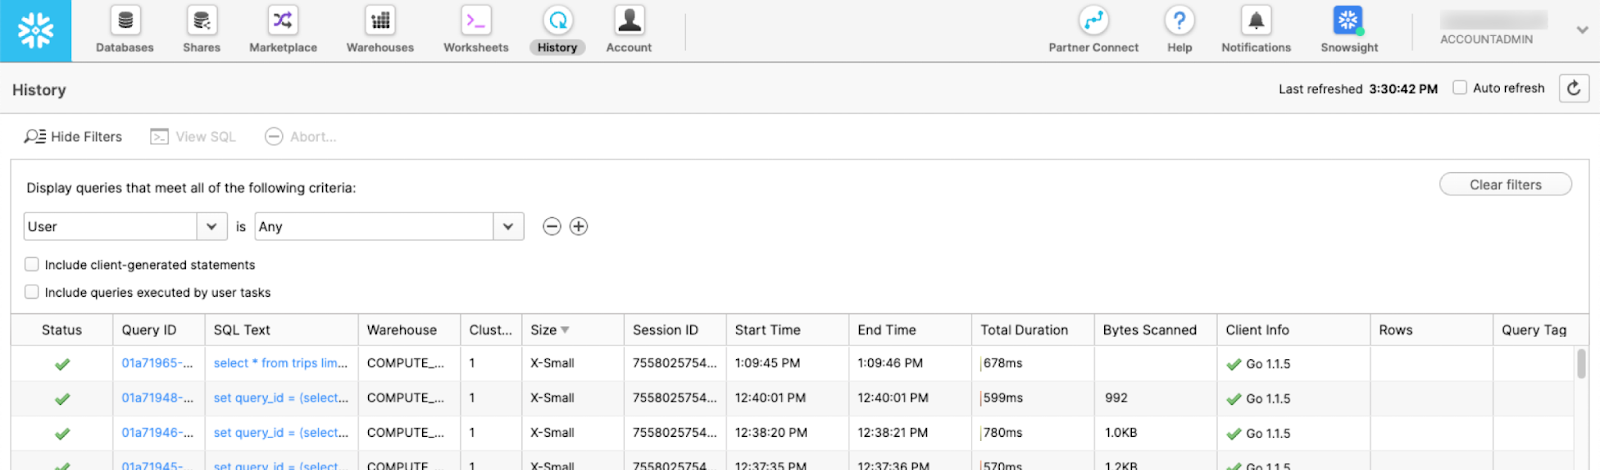
Step 3: Locate the query you want to analyze and click on its ID.
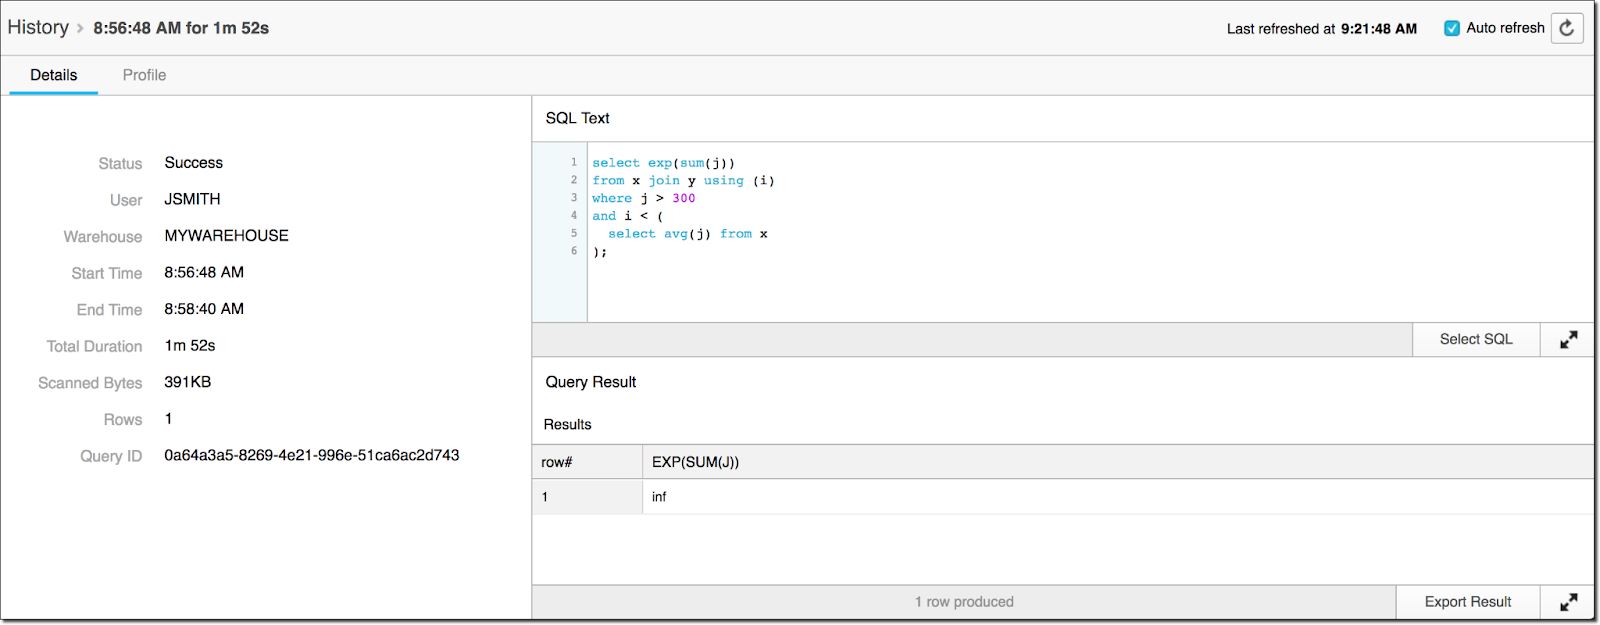
Step 4: After selecting the query, you will see an option to access the query profile. Click on "Profile."
Accessing Snowflake Query Profile using System Functions
Step 1: You need to request access to the private preview of this feature by contacting Snowflake support.
Note: This feature is not in production and is available only to selected accounts.
Step 2: Log in to your Snowflake account and open the SQL query editor.
Step 3: Use the GET_QUERY_STATS(<query id>) function in your SQL code to retrieve query statistics programmatically.
This function returns a JSON object that includes query performance details, such as execution time, resource usage, and all of the data pipeline information.
Snowflake query profile interface
Snowflake Query Profile provides a detailed visual representation of the data pipeline used to process your query. The Query Profile consists of two components:
- Query Graph View
- Query Stats Panel
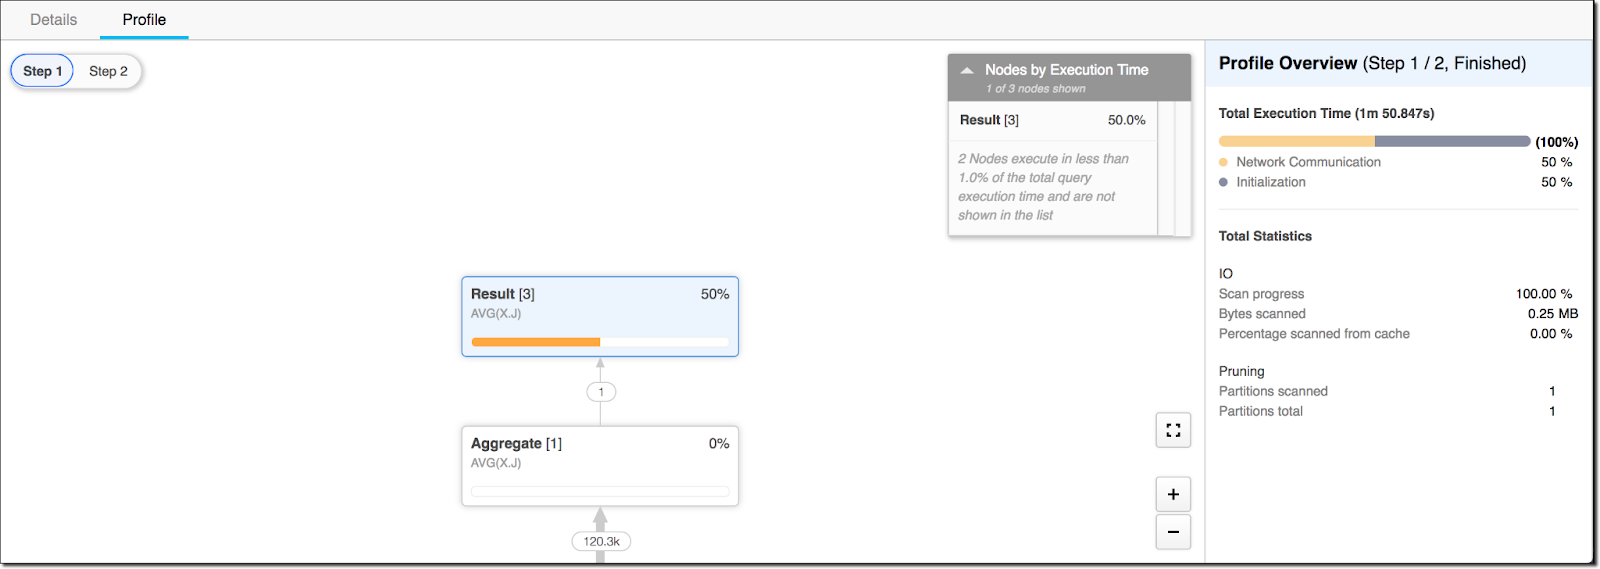
Query Graph view visualizes the flow of data through the query, with each node representing an operation in the data pipeline and each arrow representing the directional flow of information between them. Also, you can see the number of rows passing through each node along those arrows. This graphical representation helps identify specific operations for Snowflake query optimization so that you can get maximum performance from your queries!
Query stats panel, on the other hand, provides a wealth of key information that includes overall query execution time as well as the most costly operations in the data pipeline. Not only that, it breaks down execution times into CPU processing, disk (local disk and remote disk) I/O, and network transfer categories to help you pinpoint issues that can be addressed for improved Snowflake query performance.
How to Analyze a query in Snowflake Query Profile?
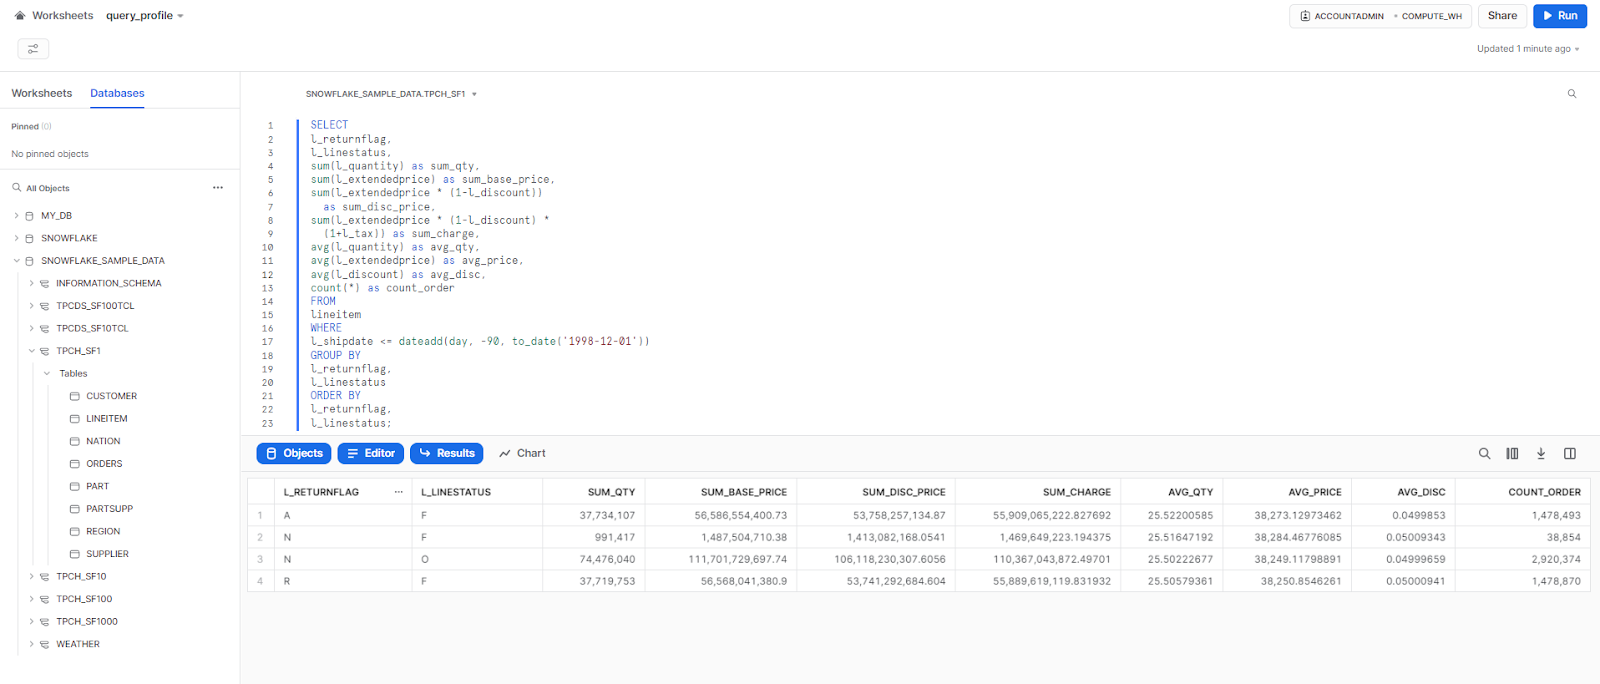
Let's explore a real-world scenario with a practical example. To begin with, we will execute a very basic query on the sample dataset provided by Snowflake.
SELECT
l_returnflag,
l_linestatus,
sum(l_quantity) as sum_qty,
sum(l_extendedprice) as sum_base_price,
sum(l_extendedprice * (1-l_discount))
  as sum_disc_price,
sum(l_extendedprice * (1-l_discount) *
  (1+l_tax)) as sum_charge,
avg(l_quantity) as avg_qty,
avg(l_extendedprice) as avg_price,
avg(l_discount) as avg_disc,
count(*) as count_order
FROM
lineitem
WHERE
l_shipdate <= dateadd(day, -90, to_date('1998-12-01'))
GROUP BY
l_returnflag,
l_linestatus
ORDER BY
l_returnflag,
l_linestatus;
This particular query aggregates the "lineitem" table and computes multiple metrics based on the group level conditions. It computes the total quantity, extended price, discounted price, charged price, and average quantity, price, and discount for each combination of the "l_returnflag" and "l_linestatus" columns, and then it proceeds to filter the results to include only the rows where the "l_shipdate" column is within 90 days of December 1, 1998. And finally, the “GROUP BY” orders the data in two columns, and the "ORDER BY" clause sorts the results in ascending order by the "l_returnflag" and "l_linestatus" columns.
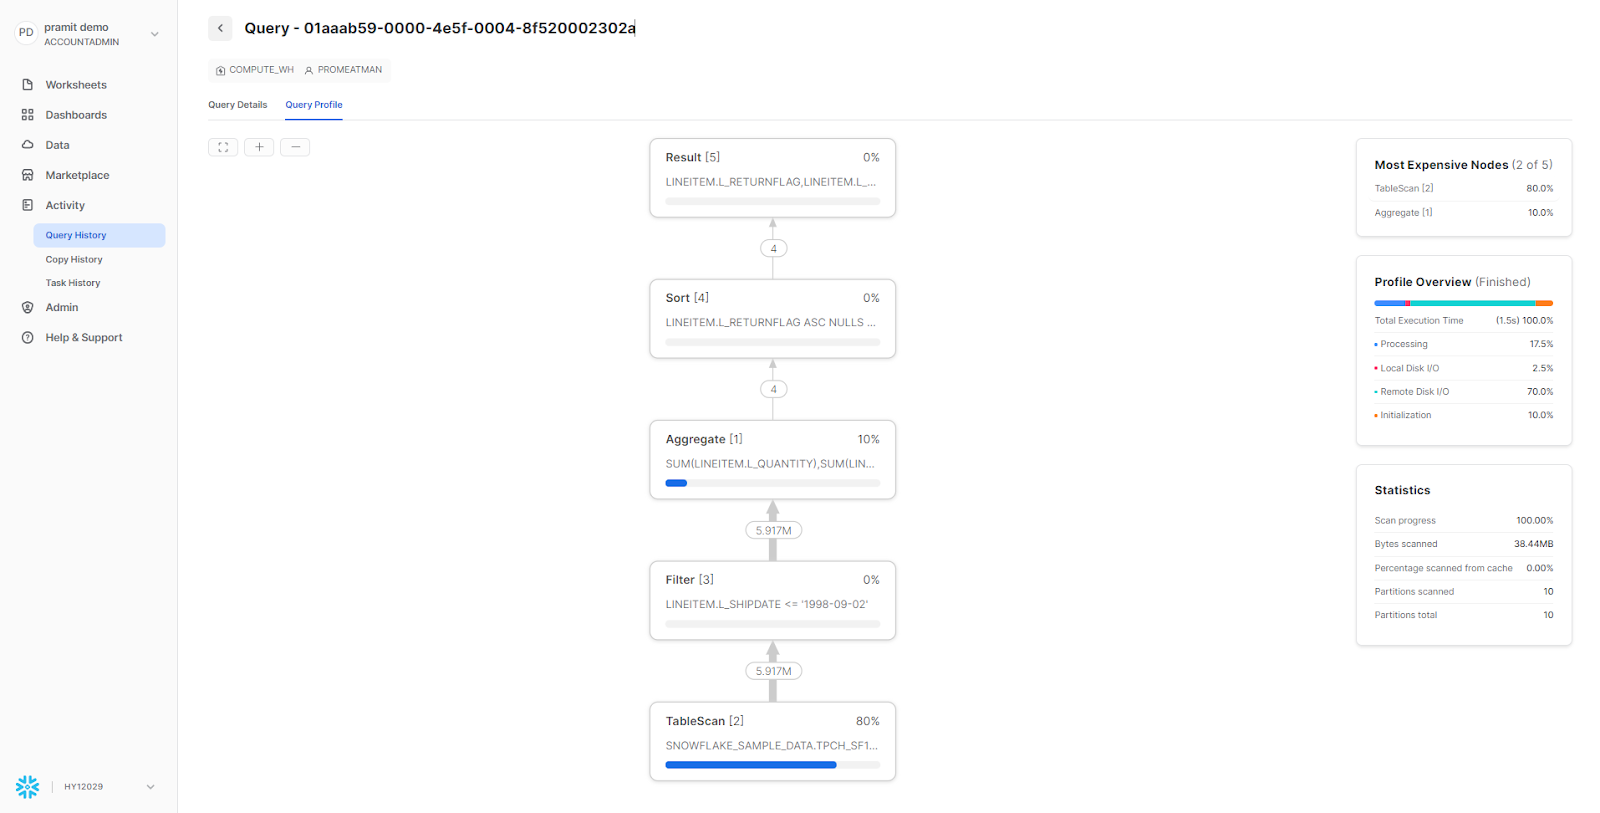
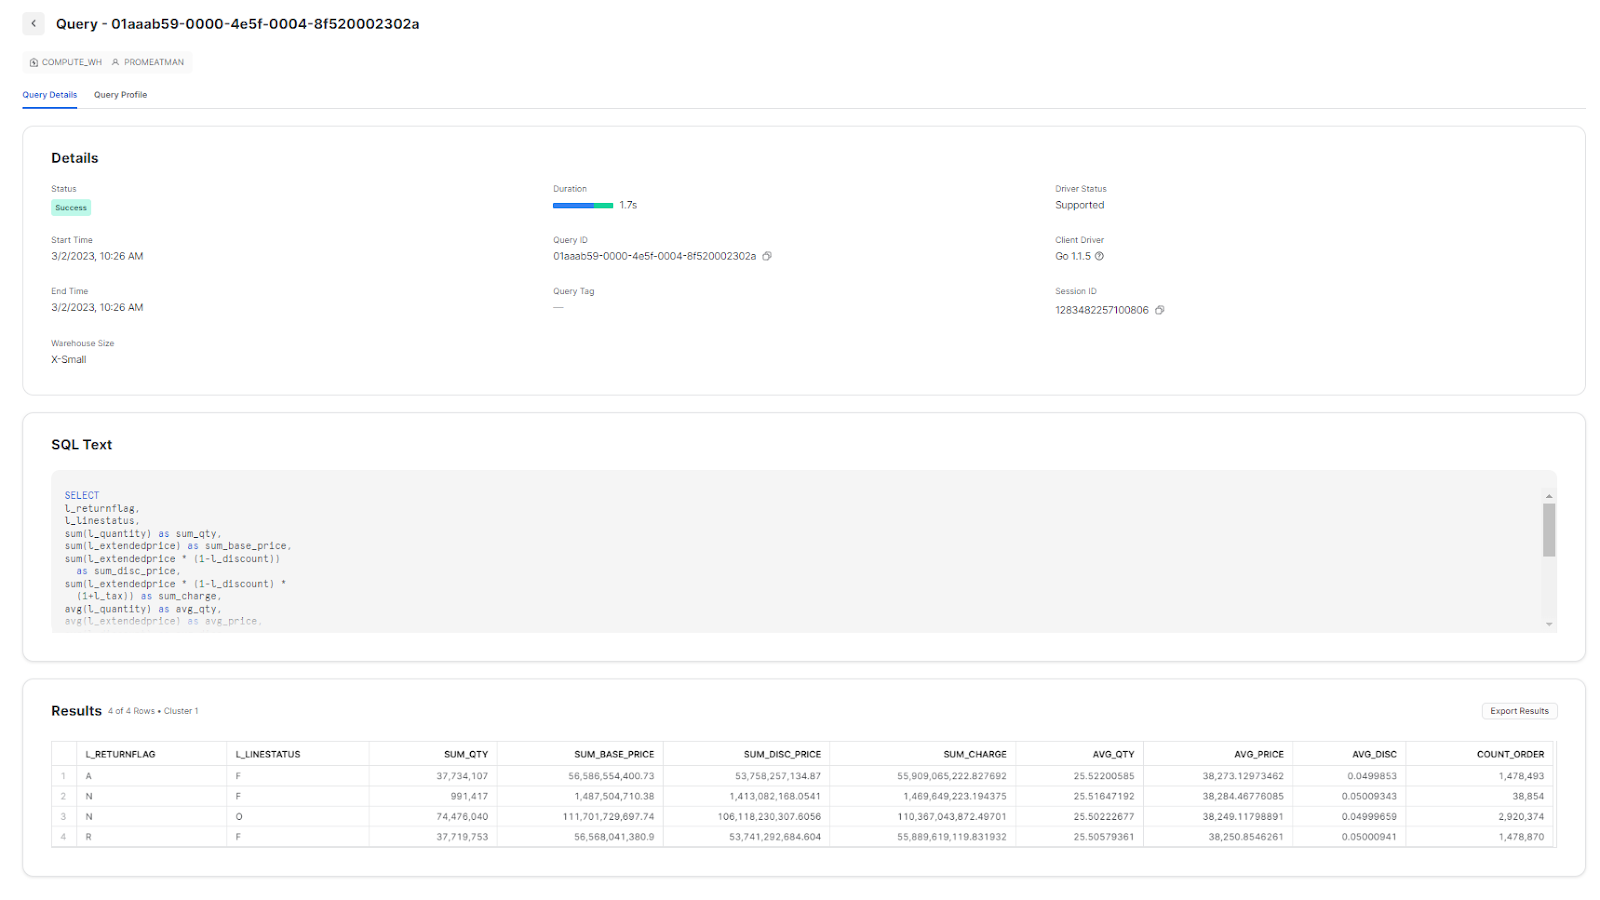
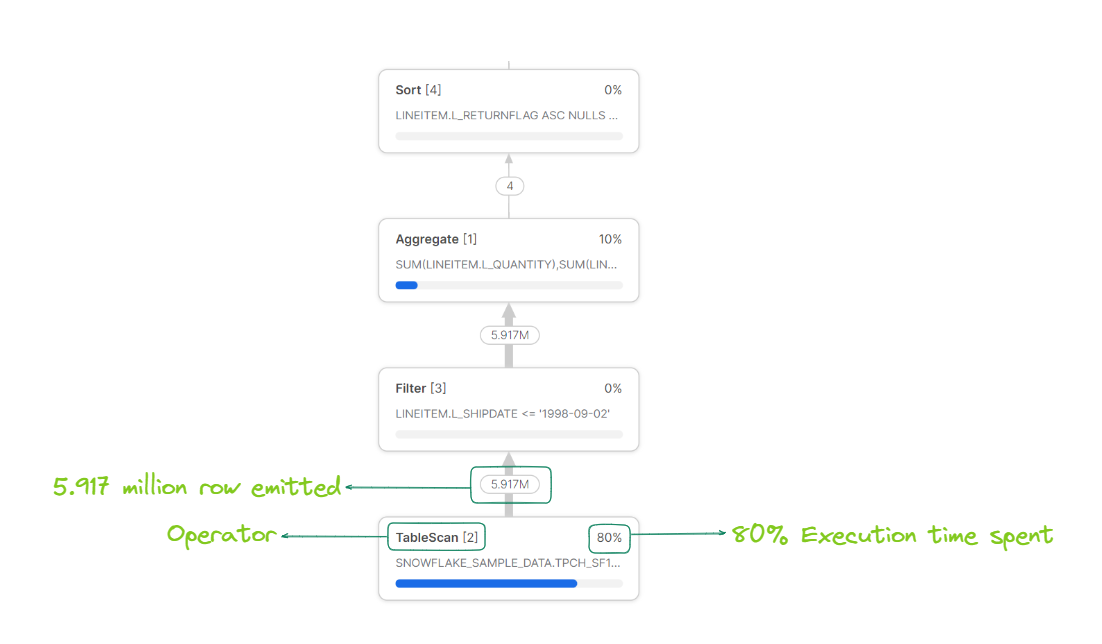
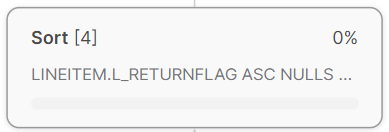
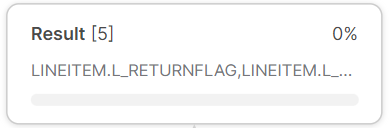
If you want to get insight into your Snowflake query performance, the query stats panel will provide you with detailed information and statistics. The panel displays each operator associated with the query and provides additional information, like which table is being scanned or the aggregations it's conducting.
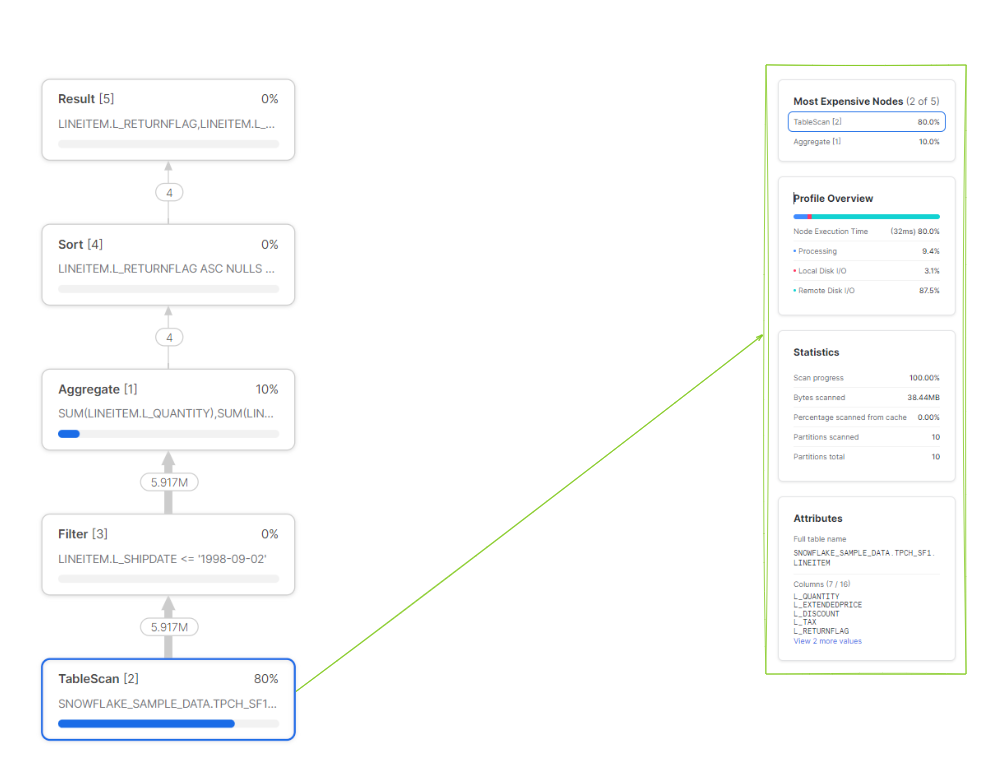
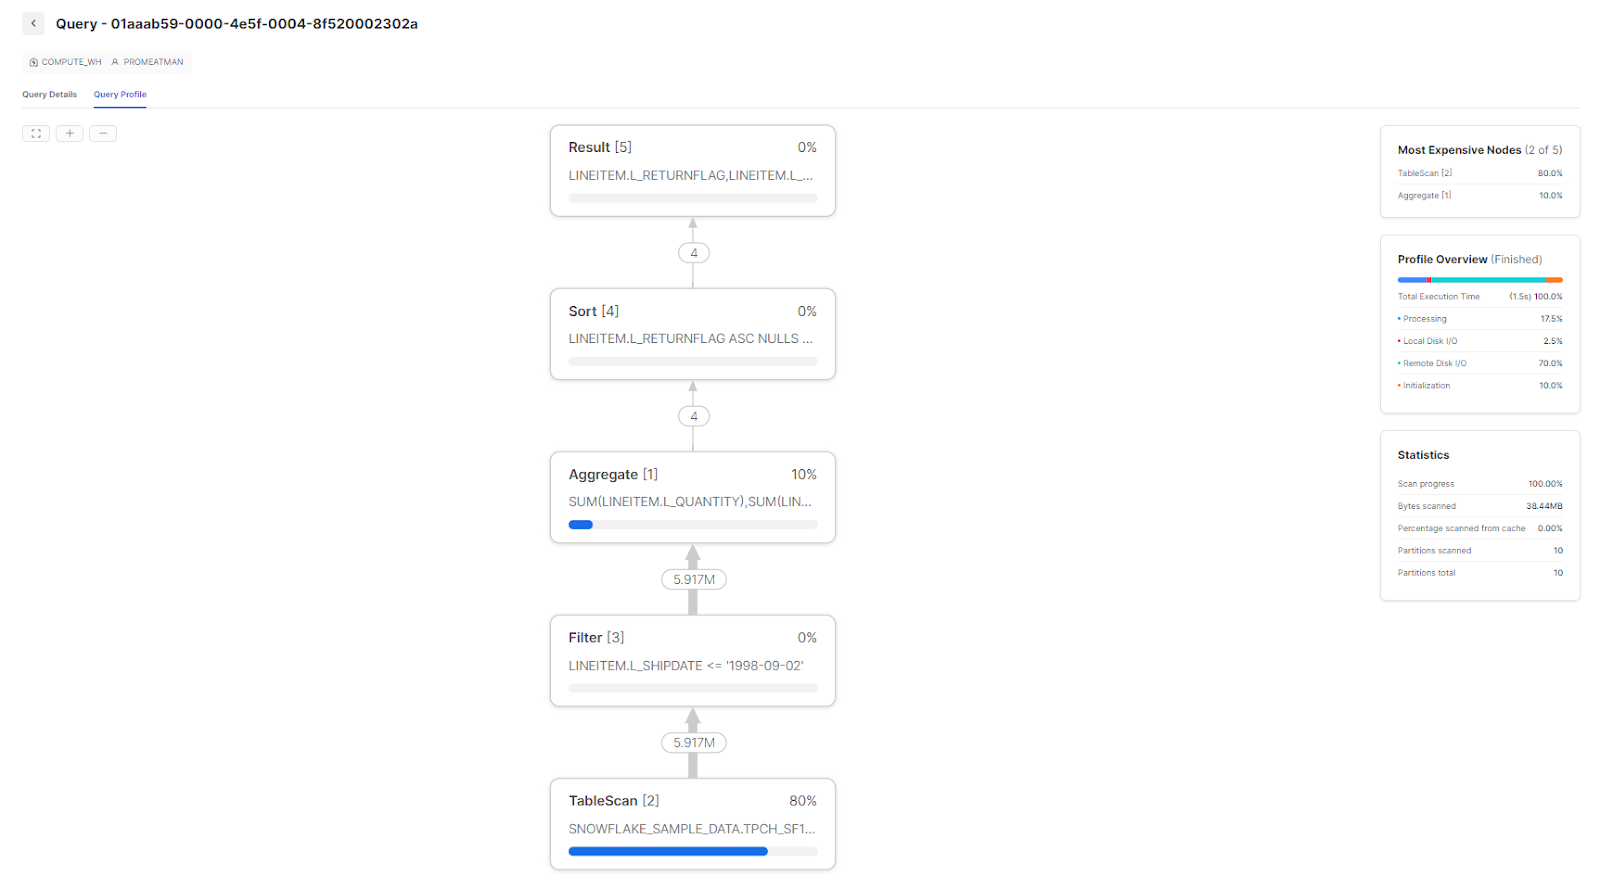
All of this is incredibly useful as it helps identify what parts of the SQL are relevant. The illustration below highlights how to map out the SQL associated with each operator.
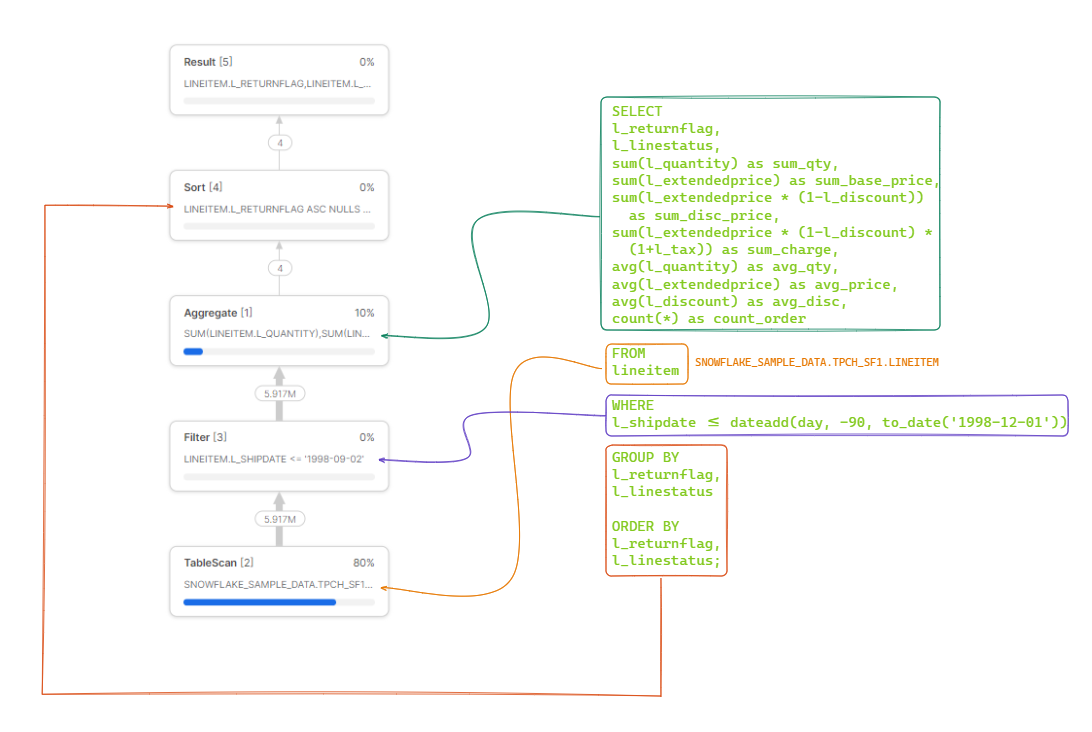
As illustrated above, in our example, this query was converted into a data pipeline consisting of five operators: Result, Sort, Aggregate, Filter and TableScan. These operators carry out a range of functions to produce a result set; for instance, TableScans search databases and tables for relevant records, while Aggregates group or accumulate values and Sort orders them. There are numerous types of operators, but these five represent some of the most prevalent that you may encounter frequently. The Snowflake UI displays these operators in a tree format; the operator at the top is the final stage, while the one at the bottom is the first.
To understand each operator better, let's look at their functionality in detail.
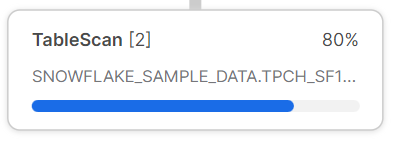
TableScan
TableScan operator is a fundamental operator in Snowflake query execution. It reads data from tables or table segments and is usually the first step in its pipeline process for most queries. The operator returns rows containing information about what it reads, like a single table name, columns, and a set of micro-partitions to scan. Each FROM statement in the query typically corresponds to a TableScan operator in the pipeline. Also, if there is a WHERE condition indicated in a query, the optimizer can use micro-partition pruning as a Snowflake query optimization method; this allows for only the required data to be accessed.
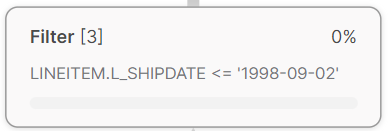
Filter
Filter operator in Snowflake is used to evaluate a Boolean expression for each row emitted by a child operator in a query pipeline. It evaluates a boolean expression on each row emitted by a child operator and only retains the rows that satisfy this condition. The Filter operator can be used to implement a WHERE clause in a query, but it can also be used for other purposes, such as calculating a running total or identifying groups of rows that satisfy a particular condition. Generally speaking, the Filter operator typically follows a TableScan or other such operator and is followed by an Aggregate or Sort Operator. Efficient use of the Filter operator can significantly reduce the amount of data that must be processed by subsequent operators in the pipeline, leading to faster query execution.
Aggregate
Aggregate operator in Snowflake is used to perform aggregation operations on a set of input rows, such as calculating sums, counts, and averages. This operator is typically used in combination with other operators, such as a TableScan and Filter, to implement queries that require aggregation. Examples of supported aggregate operations are SUM, COUNT, AVG, MIN, MAX and so on. This Aggregation technique is especially important when it comes to processing giant datasets, as it effectively reduces the quantity of data that must be processed later in the query pipeline.

Sort
Sort operator in Snowflake is used to sort the output of a child operator according to one or more specified columns. This can be used for query implementations with an GROUP BY or ORDER BY clause, but it can also be used to sort data in the intermediate stages of a query pipeline. The Sort operator accepts rows from a child operator, sorts them according to the specified columns, and then emits the sorted rows to a parent operator. Generally, it is used in conjunction with other operators, such as filter and Aggregate for advanced queries.
Result
Result operator in Snowflake is the last operator in a query pipeline that takes data from the preceding operators, formats it based on the query's output requirements and returns it to the requesting user. The Result operator is typically preceded by one or more other operators, such as an Aggregate, Sort, or Filter operator, which perform intermediate processing on the data. The Result operator is a critical component of query execution in Snowflake, as it determines the final format and content of the result set that is returned to the user. The performance of this operator can be hindered by factors like the size of the output, the complexity of the query itself, and the availability of resources on Snowflake's cluster.
In the example above, we just broke down a few simple operators, but more complex queries can include hundreds of operator nodes. To understand more about the different types of operators used in Snowflake (including those not used in this example), check out the Snowflake’s official documentation, which includes a detailed list of all the common operators.
5 Tips for Snowflake query optimization using Snowflake Query Profile
Understand the Snowflake Operators
To increase the efficiency of Snowflake queries, it is important to understand the roles each operator plays in the query pipeline and how different operators interact with one another. So, if you understand certain patterns and look at the results of each step, you can find places to improve to make the Snowflake query optimization process faster and more efficient.
Identify Performance Issues
Use the Query Profile to see which steps of the query pipeline are consuming the most time and concentrate your Snowflake query optimization efforts there. After you've identified potential performance bottlenecks, look into why some operators are taking longer than expected or using too many resources. And once these issues have been identified, you can take corrective action to increase query efficiency and minimize overall runtime.
Search for long-running stages
When analyzing the query profile, ALWAYS ALWAYS pay attention to stages that require more processing time, as these are often the most likely candidates to experience slowdowns. So by pinpointing the stages that need improvement, you can then focus your Snowflake query optimization efforts on them and work towards improving overall Snowflake query performance.
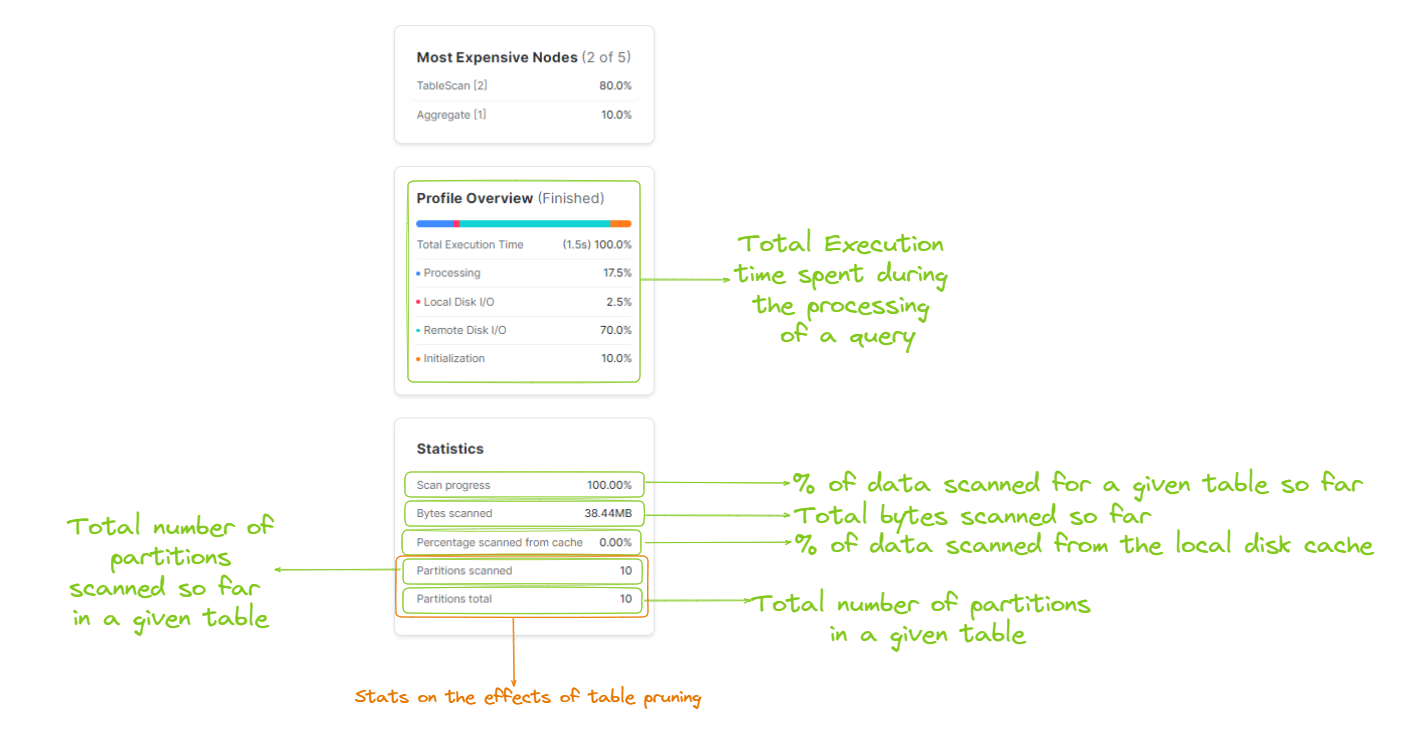
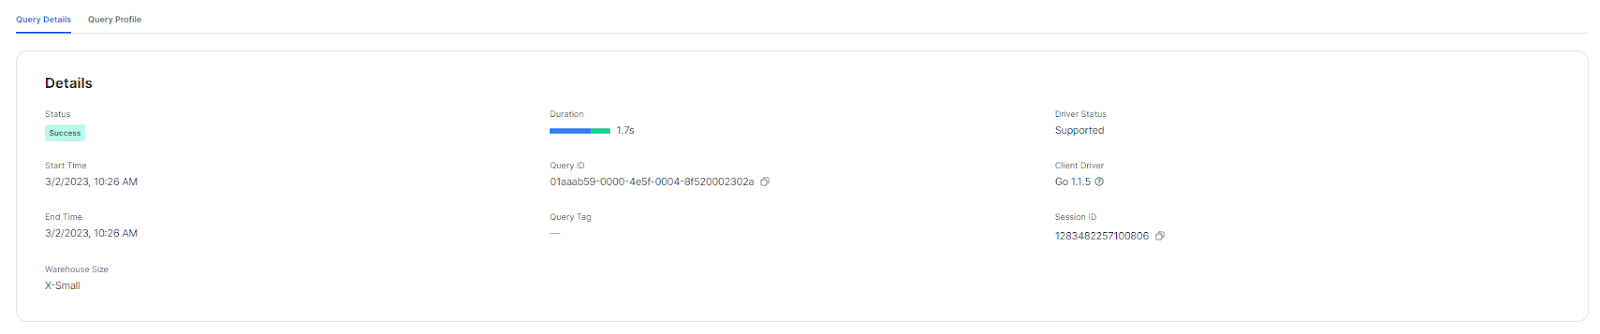
"Query Details" to identify bottlenecks
"Query Details" section of the query profile provides additional information about the data involved in the query, including the number of rows and bytes processed at each stage. Use these stats to identify bottlenecks in the query. For instance, if you see that a particular stage is processing a large number of rows, you may want to consider optimizing the query to reduce the amount of data processed.
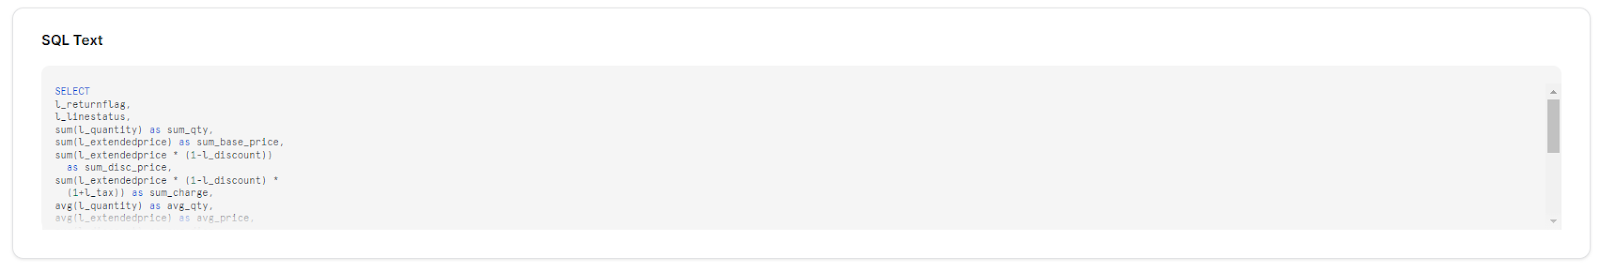
“SQL Text" to analyze the SQL code
"SQL Text" section of the query profile provides the actual SQL code that was executed. Make use of this section to analyze the SQL code and identify potential Snowflake query optimization. For instance, you may be able to optimize the query by rewriting it to use more efficient joins or filters to achieve better results.
Save up to 30% on your Snowflake spend in a few minutes!


Conclusion
Snowflake query optimization is important for any business that wants to improve the performance of their Snowflake queries, lower the costs of their data warehouses, and save serious cash. With Snowflake's Query Profile feature, you'll get a detailed view of your queries' performance and know exactly, with pinpoint accuracy, what needs to be optimized. This article covered everything you need to know about the Snowflake query profile and how to optimize it, as well as the best tips and tricks to get the most out of Snowflake and how to optimize its query performance and get the best results.
So, if you want to make sure your queries are running at their best, give Snowflake Query Profile a try today!
FAQs
What information does Snowflake Query Profile provide?
Snowflake Query Profile provides information such as query runtime stats, query execution stats, query resource usage, and query error/warning messages.
How do you profile a query in a Snowflake?
Snowflake Query Profile can be accessed through Snowsight or Classic UI by navigating to the Activity or History sections and selecting the desired query. Also, you can use the GET_QUERY_STATS function to retrieve query statistics programmatically.
How can I analyze a query using Snowflake Query Profile?
Snowflake Query Profile offers a Query Graph View and Query Stats Panel. The Query Graph View visualizes the data pipeline flow, while the Query Stats Panel provides performance metrics and information about each operator in the pipeline.
When should I use the Snowflake Query Profile?
The Query Profile should be used when you need more diagnostic information about a query, such as understanding its performance or identifying bottlenecks.
What are some things to look for in the Snowflake Query Profile?
Some indicators of poor query performance in the Query Profile include high spillage to remote disk, a large number of partitions scanned, exploding joins, Cartesian joins, operators blocked by a single CTE, unnecessary early sorting, repeated computation of the same view, and a very large Query Profile with numerous nodes.
What is the purpose of the Snowflake query profile?
The Snowflake query profile provides execution details for a query, offering a graphical representation of the processing plan's components, along with statistics for each component and the overall query.
What is an example of a Query_tag in Snowflake?
Query tags in Snowflake are session-level parameters that can have defaults set at the account and user level. For example, you can set a default query tag like '{"DevTeam": "software", "user": "John"}', and every query issued by that user will have this default tag.
How do you write an efficient Snowflake query?
To write efficient queries in Snowflake, you should focus on scan reduction (limiting the volume of data read), query rewriting (reorganizing a query to reduce cost), and join optimization (optimally executing joins).
How do you write efficient Snowflake queries?
Follow these best practices:
- Use Snowflake Query Profile tool.
- Choose the right-sized virtual warehouse.
- Maximize caching.
- Leverage materialized views.
- Optimize data clustering and micro-partitioning.
- Utilize Snowflake Query Acceleration.
- Consider using the Search Optimization Service.