


Snowflake's advanced architecture offers remarkable scalability and concurrency, but to maximize performance, continuous manual tuning and optimization are vital. We have covered various Snowflake performance tuning and query optimization strategies in our previous articles (Part 1 and Part 2).
In this article, we will build upon those foundations and discuss additional methods to maximize the speed and effectiveness of your Snowflake workloads. So whether you are just getting started with Snowflake or have been using it for years, tuning your queries for peak efficiency is an essential skill. Follow along for an in-depth look at how to monitor, diagnose, and remediate lackluster Snowflake performance.
Let’s get started!!
Why Are Your Snowflake Queries Running Slow?
Understanding the root causes behind slow performance of Snowflake queries is key to optimizing them. Before exploring solutions, it's important to zaddress some common myths about factors impacting query speed:
- Physical hardware resources do not directly affect query execution time. Snowflake is a cloud data warehouse, so it does not rely on fixed hardware resources. Your queries execute on dynamic cloud infrastructure, so the amount of hardware you provision does not determine query speed.
- Network latency has little to no effect on overall query performance. Snowflake uses a distributed architecture, executing query fragments in parallel across many nodes, meaning network latency between nodes has minimal impact compared to traditional on-premises warehouses. While it can still contribute to some slow queries, network issues are not a primary cause of consistently slow execution.
Now that we've cleared up these misconceptions, let's explore the other main potential factors for slow-running queries in Snowflake and how to achieve Snowflake performance tuning.
Want to take Chaos Genius for a spin?
It takes less than 5 minutes.

Top 5 Must-Know Techniques for Snowflake Performance Tuning
1) Check and Reduce Queuing
One of the top techniques for Snowflake performance tuning is to check and reduce queuing. Queuing occurs when the warehouse is busy executing other queries, and Snowflake cannot start incoming queries until adequate resources are free. This can happen when the warehouse is overloaded, queries in line are consuming necessary computing resources, or queries occupy all the cores in the warehouse.
To check queuing, you can look at the query history by executing the QUERY_HISTORY_BY_SESSION function.
SELECT * FROM TABLE(INFORMATION_SCHEMA.QUERY_HISTORY_BY_SESSION(RESULT_LIMIT => 5))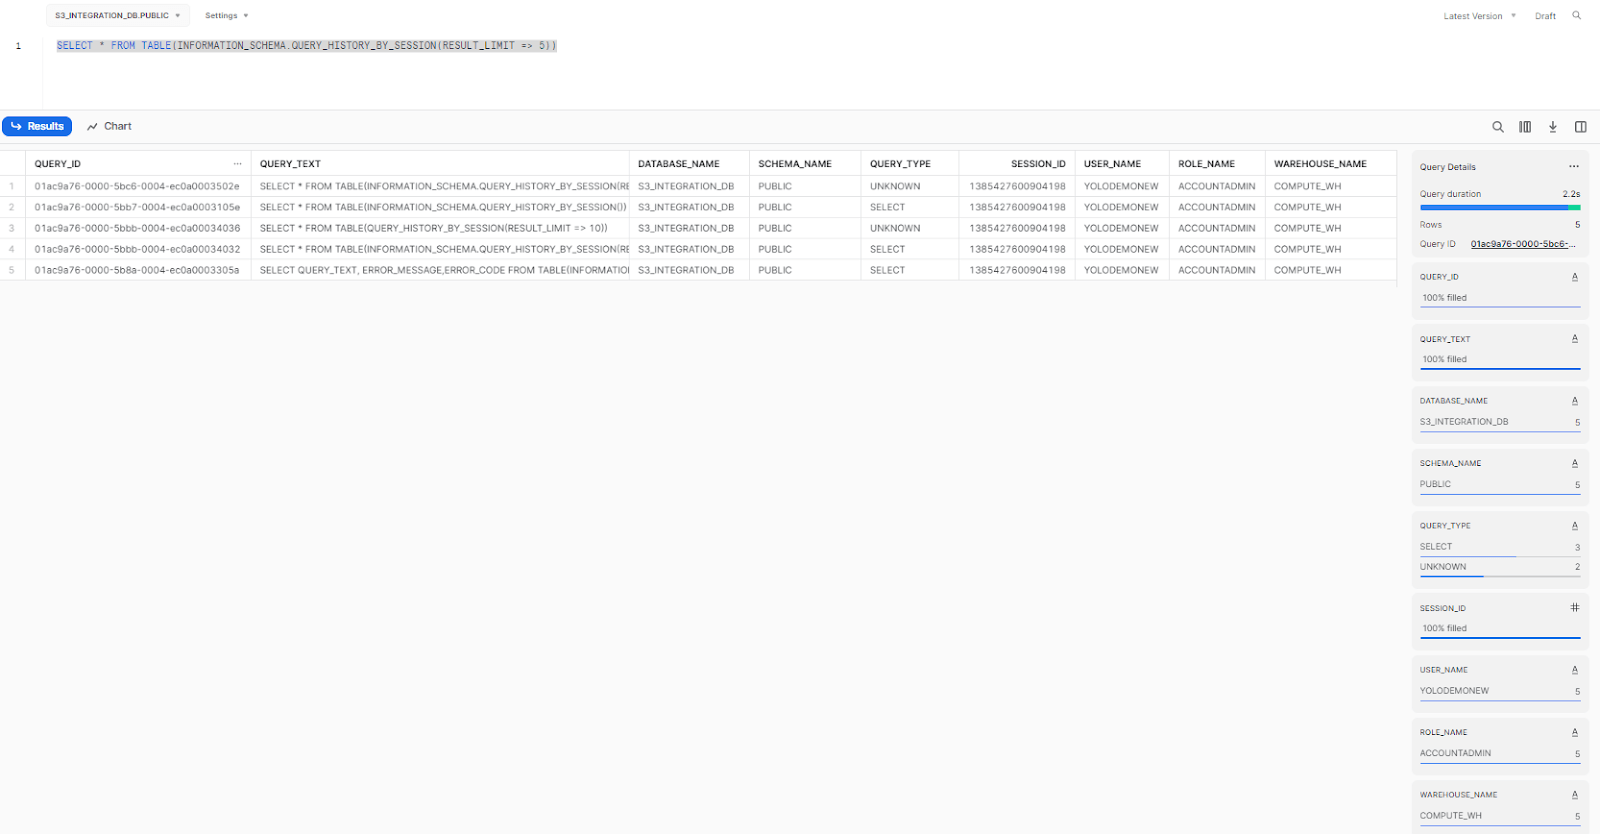
As you can see, it returns a table with information about all of the queries that have been executed in the current session.
Note: If you want to limit the number of results displayed in the console, you can use the RESULT_LIMIT parameter. However, there are other parameters that you can use to refine your result further; for example, END_TIME_RANGE_START(It specifies the start time of the time range to search for) and END_TIME_RANGE_END(It specifies the end time of the time range to search for).
How to reduce queuing?
To control how long a query can wait in the queue before being aborted by Snowflake, adjust the STATEMENT_QUEUED_TIMEOUT_IN_SECONDS. This parameter can be set at the session, warehouse, user, or account level, providing flexibility but also potential confusion if set at multiple levels. Be strategic and careful when adjusting this parameter. The STATEMENT_QUEUED_TIMEOUT_IN_SECONDS parameter specifies the number of seconds a query should wait in the Snowflake warehouse queue before being canceled by the system. This helps prevent overwhelming the warehouse with a large queue of queries. The default value is 0, meaning there is no limit enforced at any level.
To set the value for this parameter at the warehouse level, use the following command:
ALTER WAREHOUSE <Warehouse_Name> SET STATEMENT_QUEUED_TIMEOUT_IN_SECONDS=60;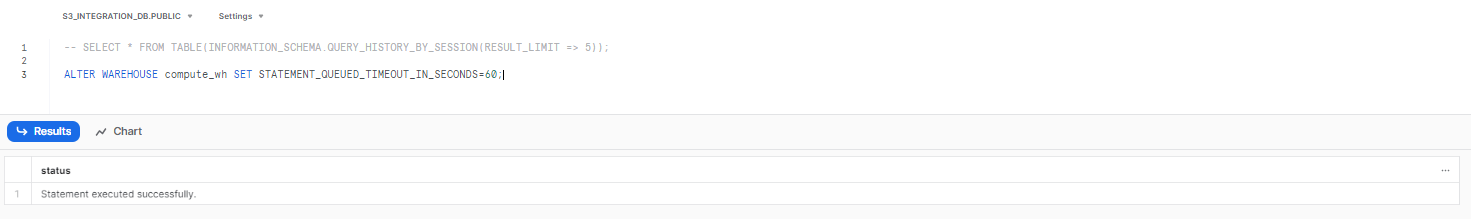
To set this parameter for a session, use the following command:
ALTER SESSION SET STATEMENT_QUEUED_TIMEOUT_IN_SECONDS=30;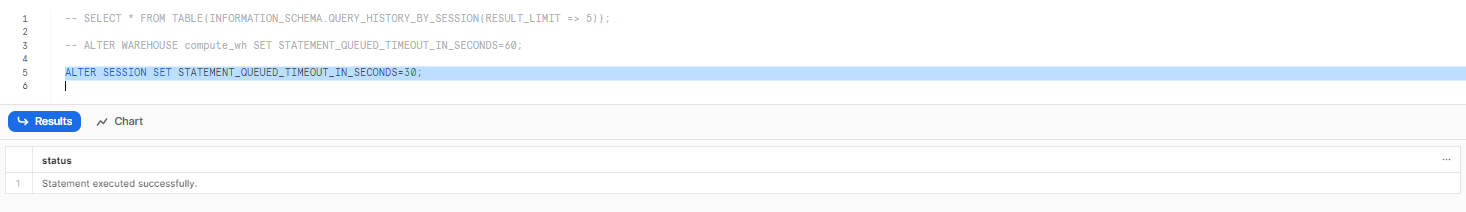
Another way to reduce the amount of time queries spend in the queue is to adjust the maximum concurrency level. This parameter controls the number of queries that can run concurrently in a warehouse.
Snowflake warehouses are either single-cluster or multi-cluster. In single-cluster warehouses, queries are queued until resources occupied by running queries are freed or additional resources are provisioned. New queries have to wait in the queue until space becomes available to execute them. Whereas, in multi-cluster warehouses, a new cluster is spun up for each new query once the maximum concurrency level is reached. The MAX_CONCURRENCY_LEVEL parameter does not limit the total number of queries. Instead, it protects warehouses from being overburdened by too many running queries. The default is 8, but it can be modified based on your needs.
This parameter works well with the STATEMENT_QUEUED_TIMEOUT_IN_SECONDS parameter, which aborts queries that have been queued for too long.
To set the MAX_CONCURRENCY_LEVEL for a warehouse, run:
Alter Warehouse <Warehouse_Name> Set MAX_CONCURRENCY_LEVEL=5;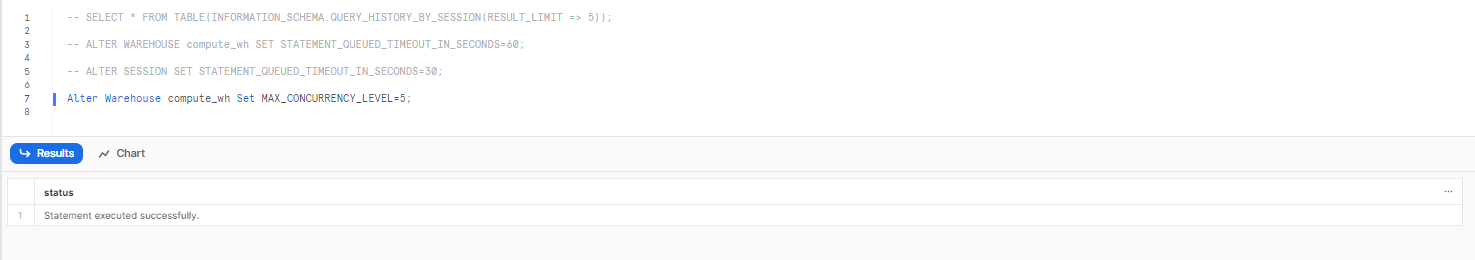
To set it at the account level, use:
Alter Account Set MAX_CONCURRENCY_LEVEL=8;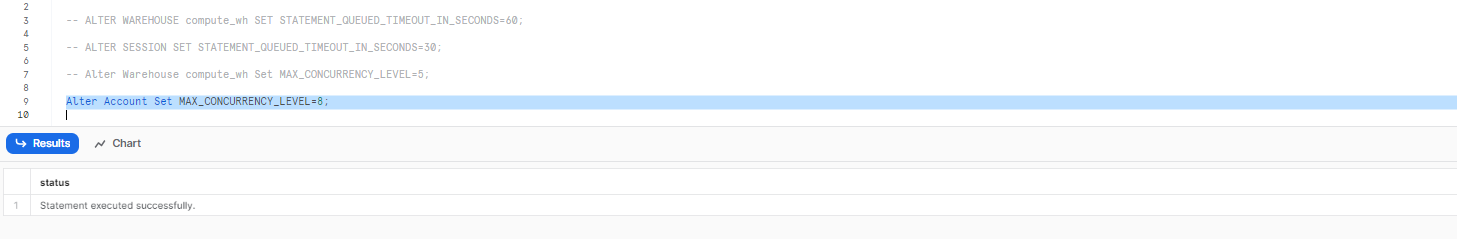
Note:
- Decreasing the concurrency level allocates more resources per query which improves performance.
- Increasing the level allows more queries to run concurrently but can reduce performance if the system gets overloaded.
- The level needs to be optimized based on your workload and available resources.
- Monitor metrics like CPU usage, memory, storage, and the number of running and queued queries to determine the right concurrency setting.
2) Make use Result Caching
Snowflake offers three cache layers: result cache, local disk cache, and remote disk cache, with result cache being the topmost and most vital layer.
Whenever a query is executed in Snowflake, the full results are stored in the Result Cache for 24 hours. Subsequent queries can then retrieve these cached results directly without re-running the full query. This avoids the overhead of parsing, optimizing, and running the query again and can significantly reduce latency.
You can access the cached results using the RESULT_SCAN function by passing in the LAST_QUERY_ID. This will pull the results from the last executed query directly from the cache.
For example:
SELECT *
FROM TABLE(RESULT_SCAN(LAST_QUERY_ID()));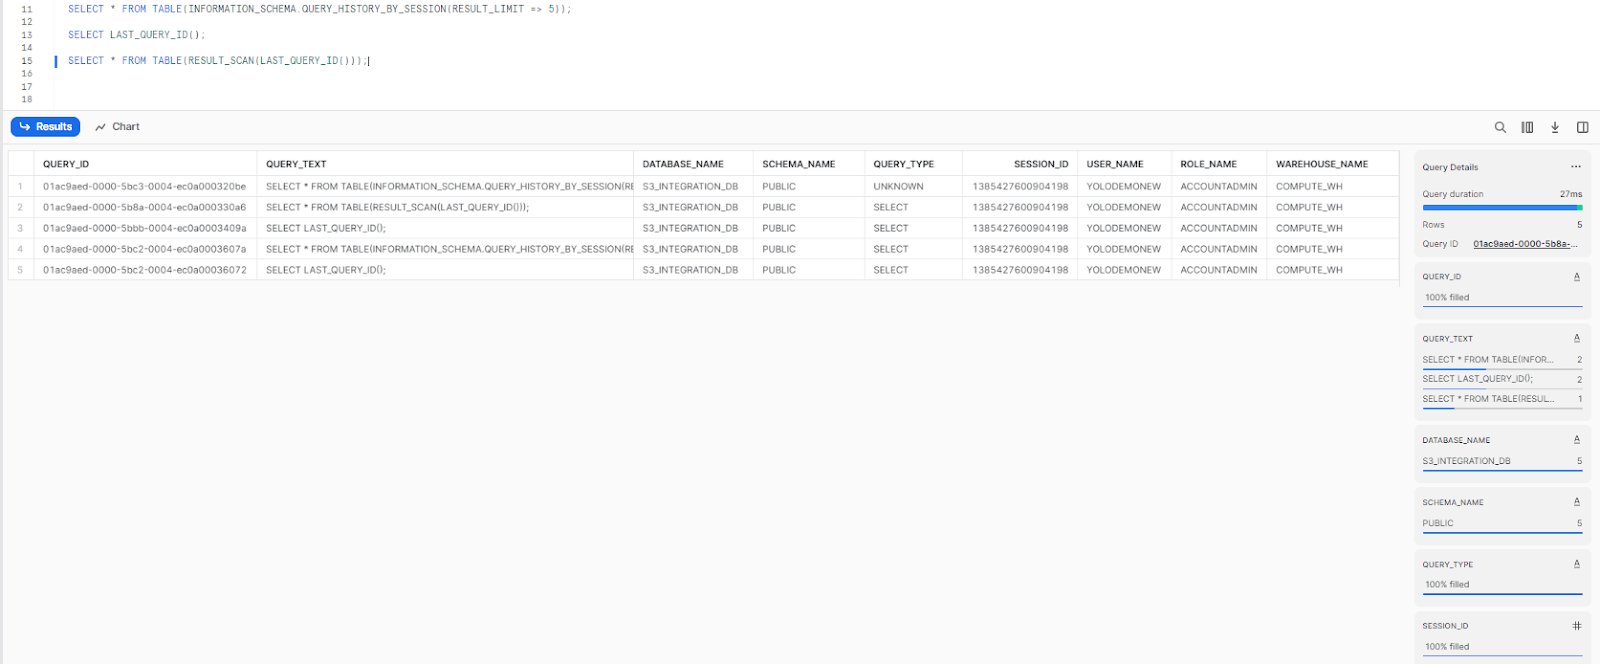
Note: RESULT_SCAN is not guaranteed to return rows in the same order as the original query returned the rows. To specify a specific order, you can include an ORDER BY clause with the RESULT_SCAN query.
3) Addressing Row Explosion in Snowflake Queries
Addressing row explosion is crucial for tuning Snowflake query performance as it helps optimize resource utilization and minimize unnecessary processing. Row explosion refers to situations where the number of rows generated during query execution is significantly larger than the original data set. Here are several techniques to address row explosion and improve query performance in Snowflake:
a) Optimizing data types and data volume:
Review the data types used for columns and consider using more compact types when appropriate. Reducing the data volume by filtering unnecessary columns or rows can significantly improve query performance and reduce row explosion.
For example:
SELECT column1, CAST(column2 AS VARCHAR(10))
FROM your_table
WHERE column3 = 'some-value';
b) Optimize subqueries:
Subqueries can contribute to row explosion if not carefully optimized. Consider rewriting subqueries as joins or using CTEs (Common Table Expressions) to improve performance.
WITH subquery AS (
  SELECT column1
  FROM table1
  WHERE column2 = 'value'
)
SELECT column1, COUNT(*)
FROM subquery
JOIN table2 ON subquery.column1 = table2.column1
GROUP BY column1;
c) Make use of the DISTINCT clause:
Adding a DISTINCT clause can help reduce the number of rows returned by a query. This is useful when there are duplicate rows that are not needed. For example, if you are querying a large fact table and only need unique dimension values, adding DISTINCT can improve performance.
SELECT DISTINCT col1, col2
FROM large_fact_table
d) Avoiding Cartesian products:
Cartesian products occur when a join condition is not specified or incorrect, resulting in a combination of every row from one table with every row from another table. Cartesian products can cause significant row explosion. Make sure that join conditions are properly defined to avoid unintended Cartesian products.
SELECT *
FROM table1
JOIN table2 ON table1.common_column = table2.common_column;
e) Make use of Temporary tables:
Creating temporary tables can help reduce row explosion. Temporary tables can help in cases where you have complex queries with multiple joins or subqueries. So, by breaking down the query into smaller steps and storing intermediate results in temporary tables, you can control the row explosion and improve query performance. Here's an example:
-- Create temporary table
CREATE TEMPORARY TABLE temp_table AS
SELECT column1, column2
FROM table1
JOIN table2 ON table1.id = table2.id;

-- Use the temporary table in subsequent operations
SELECT column1, COUNT(column2)
FROM temp_table
GROUP BY column1;
4) Optimizing Query Pruning for Enhanced Query Performance
Query pruning is a Snowflake query optimization technique that involves reducing the amount of data that must be scanned during query execution. It accomplishes this by utilizing the power of the Snowflake micro-partitions that make up a table to determine which ones contain relevant data and which ones can be skipped.
Snowflake's pruning capabilities play a crucial role in optimizing query performance. However, there are cases where pruning may not be perfect, leading to inefficient resource usage. During query execution, Snowflake prunes micro-partitions and then filters the remaining partitions' columns. This allows Snowflake to scan only the necessary data, reducing the amount of data accessed and improving query performance. However, pruning does not always work perfectly.
Addressing Pruning Limitations with Data Clustering:
To overcome these limitations and further optimize query performance, Snowflake provides a powerful technique called data clustering. So, by clustering a table, you can physically group similar data together, making pruning more efficient and reducing the amount of data that needs to be scanned.
You can cluster a table in Snowflake during table creation or by altering an existing table. Here are the examples:
Clustering during table creation:
CREATE OR REPLACE TABLE cluster_demo_table (
    id NUMBER(10,0),
    name VARCHAR(100),
    age NUMBER(3,0),
    country VARCHAR(50)
)
CLUSTER BY (age);
Clustering an existing table:
ALTER TABLE cluster_demo_table (
    id NUMBER(10,0),
    name VARCHAR(100),
    age NUMBER(3,0),
    country VARCHAR(50)
)
CLUSTER BY (age);
Data Clustering Considerations:
While data clustering is a powerful technique, it does have certain limitations. Tables with a large number of records and relatively stable data are ideal candidates for clustering. It is recommended to cluster a table when you observe slow query performance and when you know that clustering can provide enhancements.
Note: As of May, 2020, manual reclustering has been deprecated for all accounts.
Check out this article if you want to learn more in-depth about Snowflake clustering
5) Managing and Monitoring Disk Spillage
Managing disk spillage is crucial for query optimization in Snowflake. When a warehouse cannot accommodate an operation in memory, it resorts to disk spilling, where data is temporarily stored on the local disk of a warehouse node or in remote storage. Disk spilling significantly affects query performance and can be observed in the query profile as "Bytes spilled to local/remote storage." Excessive spillage can lead to noticeable degradation in warehouse performance. To mitigate the impact of disk spillage, the following steps should be considered:
- Increase warehouse size: Increasing the size of the warehouse provides more memory and local disk space, allowing for larger operations to be accommodated in memory and reducing the need for disk spilling. The code snippets increases warehouse size, enables autosuspend after 300 seconds of inactivity, and automatically resumes execution after resizing is complete.
ALTER WAREHOUSE my_warehouse RESUME;
ALTER WAREHOUSE my_warehouse SET WAREHOUSE_SIZE = 'LARGE' AUTO_SUSPEND = 300 AUTO_RESUME = TRUE;- Optimize the query: Reviewing and optimizing the query can help minimize the need for disk spilling, especially for new queries. Analyze the query execution plan and identify potential areas for improvement, such as rewriting inefficient joins or reducing unnecessary data processing.
- Improve partition pruning: Enhancing partition pruning can reduce the amount of data processed during query execution, minimizing the likelihood of disk spillage. Ensure that relevant columns are properly partitioned, allowing Snowflake to eliminate irrelevant partitions during query planning. Here's an example of improving partition pruning:
- Project only necessary columns: Limiting the columns projected in the query can reduce the overall data size processed, potentially preventing or reducing disk spillage. Instead of selecting all columns, specify only the required columns in the SELECT statement. Here's an example:
SELECT column1, column2
FROM table1;- Control parallel queries: Reducing the number of parallel queries running on the warehouse can alleviate resource pressure and minimize the likelihood of disk spillage. Limit the concurrency level of the warehouse to ensure that it is not overwhelmed with simultaneous queries. The following example demonstrates adjusting the concurrency level:
ALTER WAREHOUSE my_warehouse SET MAX_CONCURRENCY_LEVEL = 5;Save up to 30% on your Snowflake spend in a few minutes!


Conclusion
Snowflake's performance capabilities are unparalleled, but to truly maximize performance and minimize costs, Snowflake performance tuning and optimization are essential. While Snowflake can handle massive data volumes and complex queries with ease, it does not mean it always should.
In this article, we explored several Snowflake features and best practices to boost query performance.To summarize:
- Monitor and reduce queueing to minimize wait times. Queueing is often the culprit behind sluggish queries.
- Leverage result caching to reuse results and slash compute time.
- Tame row explosion with techniques like Optimizing data types and data volumes, Optimizing subqueries, Making use of DISTINCT clause, Avoiding cartesian products and making use of Temporary tables.
- Optimize query pruning to scan less data and improve query speed.
- Manage and monitor disk spillage to avoid performance impacts.
While this covers many essential Snowflake performance tuning techniques, it only scratches the surface of Snowflake's capabilities. This concludes Part 3 of our article series on Snowflake performance tuning. If you missed the previous installments, be sure to check out Part 1 and Part 2 for a comprehensive understanding of the topic.
FAQs
What are some common Snowflake Performance Tuning techniques?
Common Snowflake Performance Tuning techniques include query optimization, data clustering, result caching, monitoring disk spillage and using the right Snowflake warehouse size for your workload.
How does query optimization improve Snowflake performance?
Query optimization in Snowflake can significantly improve performance by reducing the amount of data scanned during a query, thus reducing the time and resources required to execute query.
What is the role of data clustering in Snowflake Performance Tuning?
Data clustering in Snowflake helps to minimize the amount of data scanned during a query, which can significantly improve query performance.
How does warehouse size affect Snowflake performance?
The size of the Snowflake warehouse can greatly impact performance. Larger warehouses can process queries faster, but they also consume more credits. Therefore, it's important to choose the right size for your specific needs.
Can caching improve Snowflake performance?
Yes, caching can significantly improve Snowflake performance. Snowflake automatically caches data and query results, which can speed up query execution times.
How do you check Snowflake performance?
There are several ways to check your Snowflake performance, including monitoring query execution times, analyzing query plans, and reviewing resource usage. You can also use the Snowflake web interface (Snowsight), Snowflake's built-in performance monitoring tools, such as the Query Profile and Query History views, the ACCOUNT_USAGE schema, as well as third-party tools like Chaos Genius, to gain insights into your system's performance and identify areas for improvement.
What makes Snowflake fast?
Snowflake's architecture is designed to be highly scalable and performant. It uses a unique separation of compute and storage, allowing for independent scaling of each component. Also, Snowflake uses a columnar data format and advanced compression techniques to minimize data movement and optimize query performance
How do you handle long running queries in a Snowflake?
To handle long-running queries in Snowflake, you can use the 'QUERY_HISTORY' function to identify them. Once identified, you can either manually cancel the query using the 'SYSTEM$CANCEL_QUERY' function, or optimize the query for better performance.