


Businesses today have access to more data than ever before, and with that abundance of data comes the need to analyze and utilize it. This is exactly where cloud-based data warehouses like Snowflake come in, which offer a powerful solution for analyzing, querying, and monitoring data quickly and efficiently. However, with millions of queries running on these data warehouses, it’s essential to monitor query performance and optimize these workloads.
In this article, we'll guide you through some best practices for optimizing Snowflake queries. This guide is divided into two-part series. In this part (part 1), we'll discuss different Snowflake features that can enhance query performance. In the next part (part 2), we'll delve deeper into some common mistakes to avoid while writing Snowflake queries.
7 Best Practices for Snowflake query optimization
1) Choosing the Right Virtual Warehouse size
Choosing the "right-sized" Snowflake warehouse is critical for optimizing queries as it reduces Snowflake costs and maximizes Snowflake query performance.
To choose the ideal Snowflake warehouse size, it's important to consider the specific needs/requirements of each individual query, like for complex queries that require extensive calculation, a larger warehouse is preferable; for simple queries, a smaller warehouse should suffice. Small warehouse sizes may also be sufficient for queries that don't require much compute resources or for scenarios where cost optimization is a MAIN concern. Therefore, when scaling up or down the Snowflake warehouse size, it's crucial to strike a perfect balance between the specific requirements of each query and select the appropriate or "right-sized" warehouse size to optimize query performance and reduce Snowflake costs.
It is advised to start with the smallest warehouse size, X-SMALL, and measure your workload’s performance. A good indicator of your warehouse being too small is the local and remote spillage shown by your queries. Read more about local and remote spillage and their possible solutions here. If Snowflake’s Warehouse Load monitor shows a significant amount of queuing, you can make the Warehouse a multi-cluster warehouse with a maximum cluster size of 2 or 4.
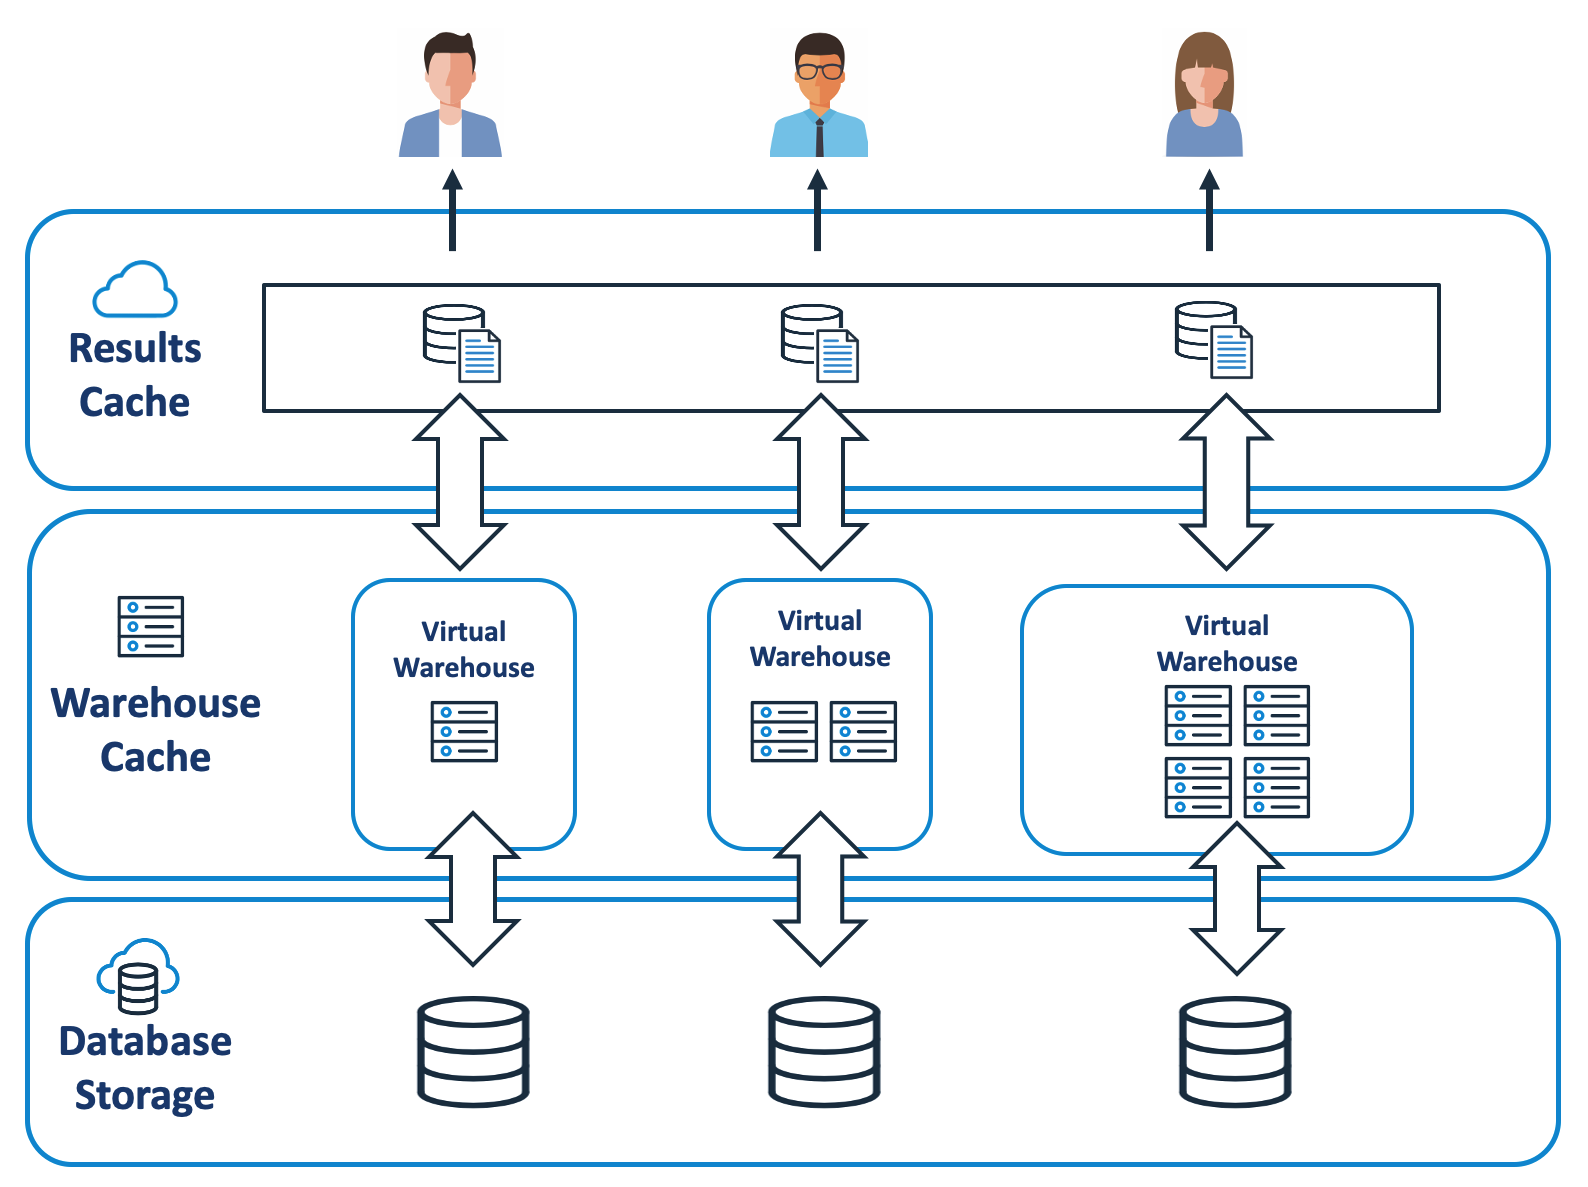
2) Using Caching in Snowflake
Another best practice for Snowflake query optimization is maximizing the use of caching. By default, Snowflake automatically caches query results; it stores the outputs of each query in memory, allowing for faster retrieval of the same data in subsequent queries, resulting in increased snowflake query performance and decreased latency when compared to fetching new data. Caching also allows for post-processing of the cached results, making it easier to perform complex tasks with fewer resources.
Snowflake offers three cache layers: result cache, local disk cache, and remote disk cache.
Result Cache: It stores previously-executed query results in memory for a short period of time, allowing subsequent queries that require the same data to be executed faster because the data is already in memory.
Local Disk Cache: It caches frequently accessed data utilized by SQL queries. Whenever data is required for a certain query, it is fetched from remote disk storage and cached in both SSD and memory, resulting in faster query execution.
Remote Disk Storage: It is in charge of storing data that is infrequently used but must be kept on hand for an extended period of time. It adds an extra layer of redundancy, guaranteeing that your data is not lost even in extreme circumstances such as system outages or disasters.
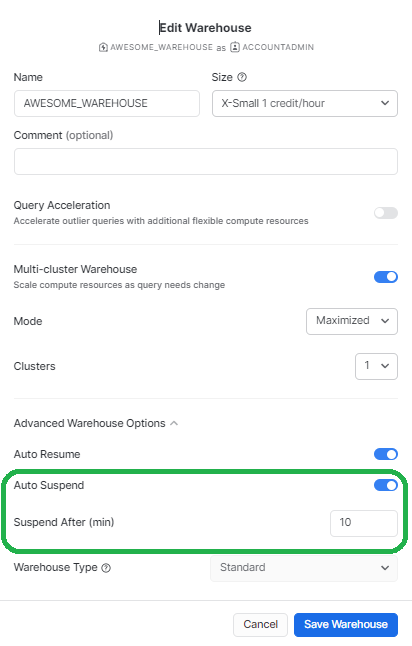
Auto-suspend: Snowflake will auto-suspend a warehouse after 10 minutes of idle time or the set auto-suspend limit. Choosing the right auto-suspend time limit is crucial to strike a perfect balance between the cost of compute resources with fast query performance. To better understand this, consider two scenarios:
For instance, if you set the auto-suspend setting to suspend after 1 minute, the warehouse may restart with the clean cache, leading to a delay in the execution of the initial queries until the relevant data is cached again. On the other hand, setting the auto-suspend feature to suspend never or large intervals like 10 mins can keep the cache warm for longer durations, but it will incur costs for compute resources even when no queries are being executed. To solve this, it is best to start with the auto-suspend set to the minimum possible limit of 60 seconds and then experiment with higher auto-suspend once one starts observing slowing query performance.
Save up to 30% on your Snowflake spend in a few minutes!


3) Using Materialized Views
Materialized views in Snowflake are simply precomputed views that store the results of a query. The data in a materialized view is updated incrementally as changes are made to the underlying data. Because the data is pre-computed, querying a materialized view is faster than executing a query against the view's base table.
It is recommended to leverage materialized views in the following scenarios:
- If the query is executed on file-based data, such as JSON or CSV files. Materialized views can improve Snowflake query performance by converting file-based data into the columnar format.
- If the view's data does not change frequently but is used often.
- If the query involves complex computations or aggregations, which can be time-consuming to compute each time the query is fired.
- If the query is on an external table with slower performance compared to querying native db tables.
Learn more in-depth about it from the official Snowflake documentation.
4) Data clustering and micro-partitioning
Data clustering in Snowflake is simply a process of organizing data within a table based on one or more clustering keys.
So what exactly is "cluster keys"?
Cluster keys are a subset of columns that are explicitly specified to keep similar rows in the same micro-partition, which can significantly improve query performance by reducing the amount of data that needs to be scanned. So whenever data is clustered, Snowflake stores related data together on the same storage blocks, making it really easy to access that data when executing queries.
Okay, hold on! So what is micro-partitioning?
In Snowflake, all data is loaded by default into small chunks known as "micro-partitions". Whenever the data is loaded into Snowflake tables, it automatically divides them into these micro-partitions, each containing between 50 MB to 500 MB of uncompressed data. As a result, each micro-partition corresponds to a group of rows and is arranged in a columnar fashion.
Let's suppose you have a huge table with a size of more than a terabyte or even a petabyte scale. It is crucial not only to store and manage such enormous data volumes but also to maximize snowflake query performance on such tables.
As previously mentioned, one way to handle such a table is to create a cluster key. By creating a clustering key, Snowflake keeps rows with similar data of the clustering key in the same micro-partition. While querying the table using the clustering key as a filter, Snowflake skips entire micro-partitions without having to look into their data. This is known as partition pruning. This can increase the query performance very significantly.
5) Using Snowflake Query Acceleration
Snowflake Query Acceleration is a feature of Snowflake that is available only in Enterprise Edition or higher. Snowflake Query Acceleration Service (QAS) is a feature built into all Snowflake Virtual Warehouses. It can help to drastically improve query performance by automatically adding additional compute resources to complete large table scans. QAS is like a booster for the queries that scan massive amounts of data volumes.
Let's say that when you run a query in Snowflake, it first checks to see if it has enough resources to run the query. If the cluster is already too busy, the query gets queued and put on hold, which can be a big problem when running massive workloads that include both short queries and long queries. Long-running queries also stop other queries from running. Most of the time, moving to a bigger warehouse is the only viable option. But if you run big queries on an X-LARGE cluster, execution times will be faster for sure. But as we've already talked about, this isn't the best solution because short queries don't use all of the resources, which can lead to huge overall query costs. Fortunately, the Query Acceleration Service (QAS) can act as a powerful additional cluster that’s temporarily available to deploy alongside your existing warehouses. When needed, it takes on some of the grunt work. QAS resources are charged on a per-CPU-second basis, so you only ever pay for the compute resources actually used.
Snowflake query acceleration service is not enabled by default; to turn it on, you need to fire the following command:
ALTER WAREHOUSE <warehouse_name> SET ENABLE_QUERY_ACCELERATION = TRUE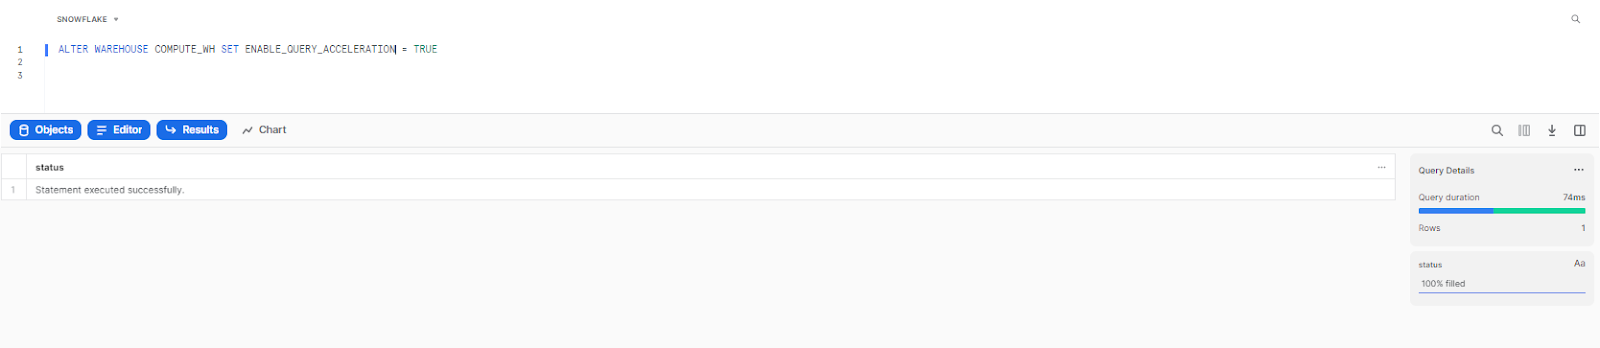
Learn more in-depth about QAS from the official Snowflake documentation
6) Making use of the Snowflake Query profile tool
Snowflake Query Profile is a feature of Snowflake that provides a comprehensive, detailed report and insight into the Snowflake query optimization and execution. Query Profile is easily accessible through the Snowflake web user interface.
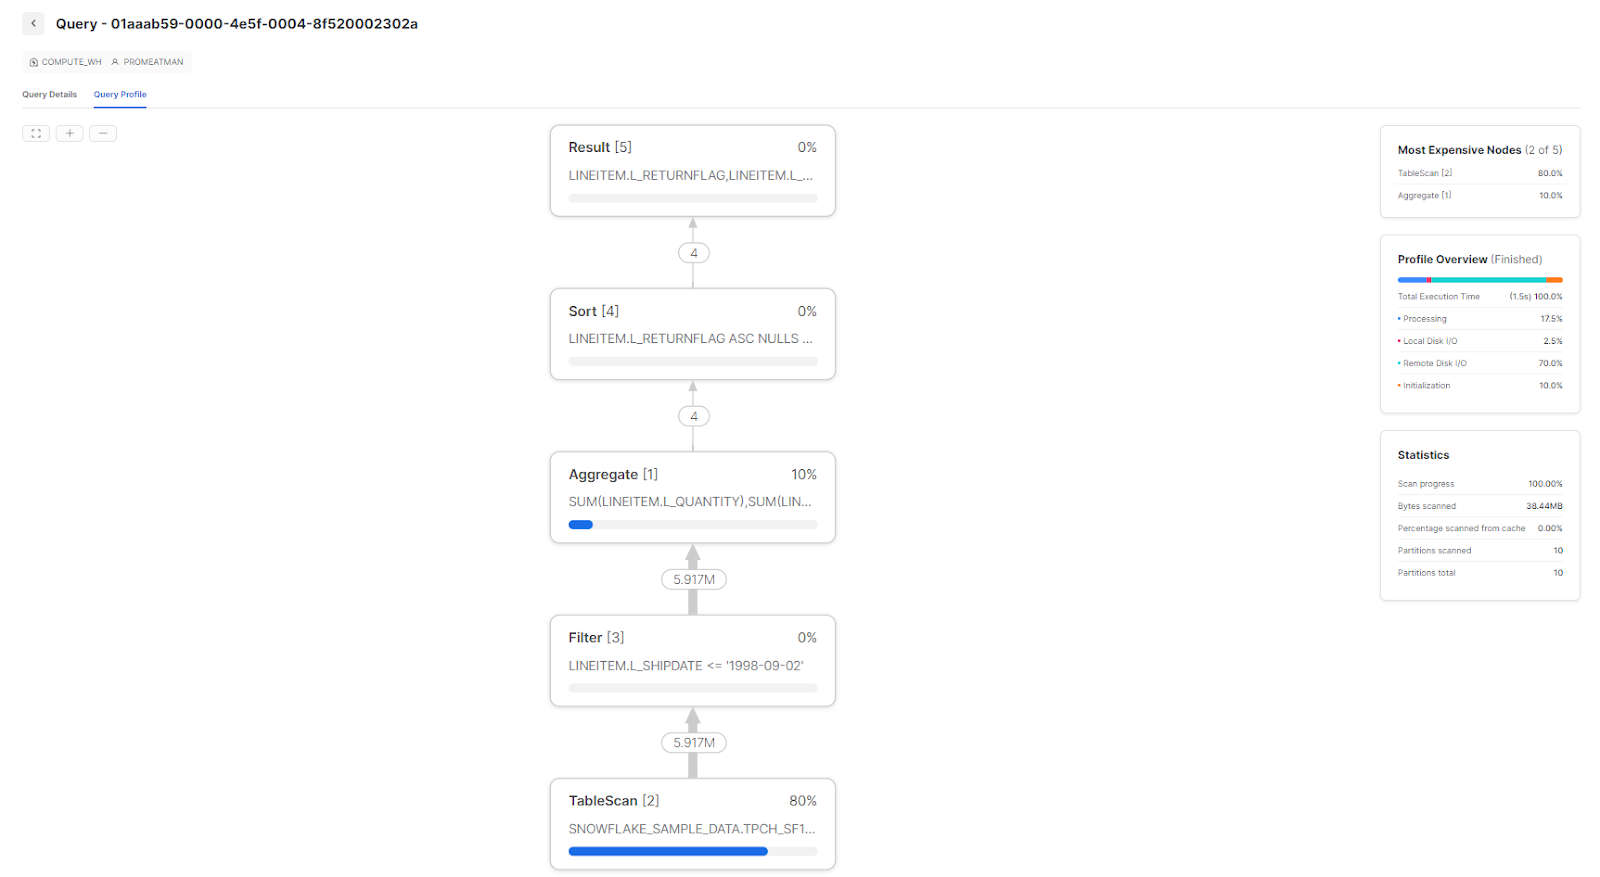
Snowflake query profile is an automatic profile that is generated after each query execution, providing you with a variety of metrics and data to help you better understand the snowflake query performance.
Using the Snowflake Query Profile tool can help identify several common issues with Snowflake query performance, which include:
Check out this article to learn everything you need to know about Snowflake query profile
7) Using the Snowflake Search Optimization Service
At last, we have a Snowflake Search optimization service, which is considered one of the best ways to optimize Snowflake query performance.
Search Optimization Service is a feature only available in the Enterprise edition or higher. The Search Optimization Service kind of acts as a background maintenance service in Snowflake that is responsible for optimizing the performance of certain types of lookup and analytical queries. It relies on a persistent data structure that serves as an optimized search access path capable of scanning all the table micro-partitions and records each individual metadata about the data in each partition, which in turn helps Snowflake build the best search access path for table data. So, whenever a user executes a query, the Snowflake optimizer looks for the shortest and best access path for that data to give the quickest response if the Search Optimization Service is enabled for that particular table.
To enable the search optimization service (it's not enabled by default), you need to contact Snowflake Support. Also, note that access control privileges are required for search optimization services.
To configure search optimization for a table, you must have the "OWNERSHIP" privilege on the table and the "ADD SEARCH OPTIMIZATION" privilege on the schema that contains the table.
You can easily grant the privilege by executing the following command:
GRANT ADD SEARCH OPTIMIZATION ON SCHEMA <schema_name> TO ROLE <role>BUT, to use search optimization for a query, you only need the SELECT privilege on the table. You don’t need any additional privileges since SEARCH OPTIMIZATION is a table property that is automatically detected and used when querying a table.
Want to take Chaos Genius for a spin?
It takes less than 5 minutes.

Conclusion
Snowflake query optimization is essential for maximizing performance and avoiding excessive Snowflake costs. Snowflake can handle large amounts of data and process large queries; however, it's important to remember that just because it can handle such volumes, it doesn't necessarily mean it should. To get the most out of the Snowflake platform, monitoring and following best practices for optimizing queries is really very important.
This is the end of Part 1 of the article, where we covered various different Snowflake features that can help improve Snowflake query optimization. Here's a summary of what we covered:
- Choosing the proper virtual warehouse size
- Using caching and optimization of auto-suspend configurations
- Performing data clustering and micro-partitioning
- Using Snowflake Query Acceleration
- Using Materialized Views
- Utilizing the Query Profile tool
- Using the Snowflake Search optimization service
In the second part of the article, we will delve further into the topic by discussing common mistakes to avoid when writing Snowflake queries.
FAQs
Why does Snowflake performance tuning matter?
Snowflake performance tuning is essential because it can deliver faster query results and help save costs by optimizing resource usage.
What is query optimization in Snowflake?
Query optimization in Snowflake refers to the process of optimizing queries to achieve optimal performance, minimize resource usage, and reduce data warehouse costs. It involves employing various techniques and practices to streamline query execution.
How does Snowflake execute queries?
Snowflake executes queries by distributing the workload across multiple nodes in a Virtual Warehouse, leveraging parallel processing and query optimization techniques.
What is Snowflake caching, and how does it improve query performance?
Snowflake caching involves storing query results in caches at the Cloud Services and Data Warehouses layers. Caching improves query performance by reducing the need for remote storage access.
How does partition pruning work in Snowflake?
Snowflake uses partition pruning by utilizing metadata statistics to narrow down the search to specific micro-partitions, significantly improving query performance on large tables.
How can I identify and improve queries with poor performance in Snowflake?
Monitoring query history, examining statistics such as partitions scanned and rows fetched, and identifying areas for improvement can help optimize queries in Snowflake.
What is the impact of warehouse size on query performance in Snowflake?
Increasing warehouse size in Snowflake maximizes throughput by distributing the workload across more nodes, but it doesn't directly increase query speed.
Why is a Snowflake query slow?
Generally, Snowflake executes queries quickly without requiring any intervention. However, a slow query is typically indicative of a mistake in the way the query is written.