


Data Analytics can boost decision-making 5X faster for businesses. It is predicted that a third of large-scale organizations will adopt decision intelligence by 2023 (Source: Information Week). Employing Augmented Modern BI tools is becoming a staple for businesses to grow exponentially and uncover insights from troves of data that cannot be parsed by a human mind.
Most businesses currently use data visualization tools like PowerBI, Tableau, Mode, Metabase, Superset to monitor their KPIs. These Business Intelligence tools are great at visualizing the data and telling users how their selected KPIs are changing. However, these tools & dashboards are severely limited in their ability to:
a) help users enable KPI Observability across multiple dimensions*
b) automated anomaly detection & monitoring
c) help users perform Root Cause Analysis
d) suggest Action Items to users and,
e) collaborate effectively on action items
*For example, Revenue (across 50 products, 50 zip codes, 8 channels) results in (50x50x8) 20000 metrics
As Augmented Analytics takes the BI world by storm, here are the 7 must-have features to look for as you upgrade to a Modern Data Analytics Stack.
#1 Data Connectors
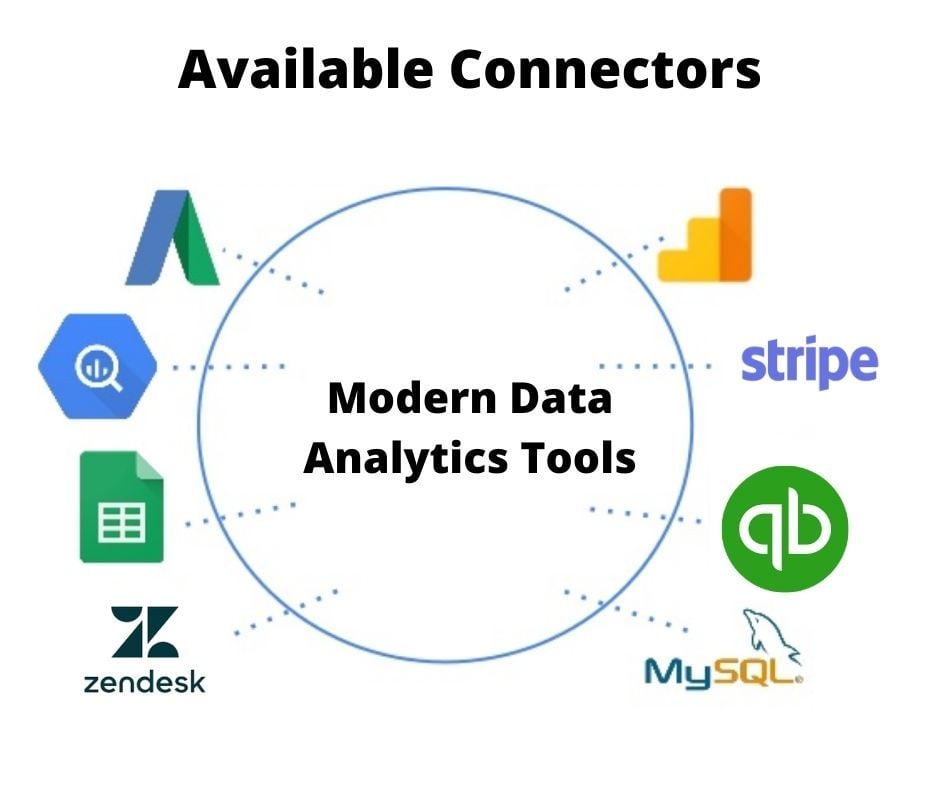
Increasingly more and more of a company’s data is sitting with external tools - CRM tools like Zendesk, Ad platforms like Google Ads, Payment providers like Stripe, Accounting tools like Quickbook, and more. A modern data analytics tool offers pre-built data connectors taking away the burden of managing complex ETL processes to analyze external data sitting with multiple tools.
#2 KPI Library & Blueprints
Lack of a standard KPI definition framework can cause chaos in an organization and make leaders lose trust in analytics. A modern Business Intelligence tool should be able to enable users to create a centralized KPI library as a Single Source of Truth for KPI definitions and connected to the rest of the data pipeline. For 3rd party data sources, a modern BI tool should come with pre-defined KPI blueprints to reduce the setup time from months to less than a few hours.
#3 Automated Anomaly Detection
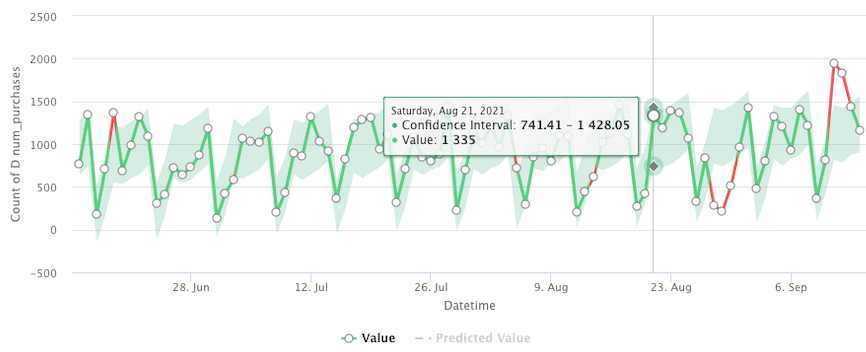
As the volume of data that needs to be monitored and analyzed explodes, it becomes imperative for businesses to use Machine Learning-based tools to monitor their metrics. One such powerful technique to detect deviations in business and system metrics is Anomaly Detection. Using automated Anomaly Detection, it is possible to enable end-to-end business observability without having to manually set up dashboards one metric at a time. Using automated Anomaly Detection tools can enable businesses to reduce their Mean Time To Detect (MTTD) and Mean Time to Resolve (MTTR) for production issues.
#4 Multi-Dimensional Drill Downs
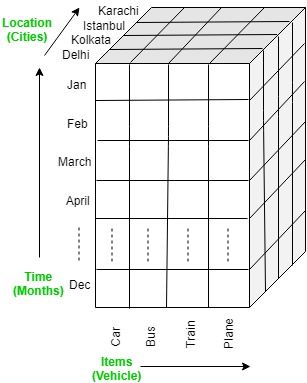
Most BI tools enable users to track top-line metrics (example: Number of Orders) with the ability to manually slice and dice the data across various dimensions (example: By City, By Day of Week, By Time of Day, By Product ID, By Partner ID). However, it's not possible to monitor the data across all dimensions using traditional BI tools. But now, using Machine Learning, it is possible to enable automated multi-dimensional drill-downs to surface the most important cuts of the data that are impacting the overall KPI. One does not need to spend countless hours of manual work in setting up multiple Pivot Tables in excel just to identify which dimensions are causing the largest impact to the top-level KPI. With Modern Business Intelligence tools like Chaos Genius, it's now possible to identify that [city=palo_alto][day=tuesday][promo_code=femalefounders] led to the maximum spike in orders this week!
#5 Data Quality Observability
Broken data pipelines and bad data quality can often result in erroneous BI dashboards leaving business and analytics teams flustered. Modern BI tools come with pre-built data quality observability to help find breaks in the data update, to enable data validation, and to identify which tables got impacted. Keeping regular tabs on the data using Data Observability can tackle & minimize the problem known as “data downtime”, which refers to the inaccurate breaks or errors in data. This leads to an increase in cost-saving, enhancement in synergy between data engineers and business teams, and boosting productivity.
#6 Auto-RCA
Most BI tools and dashboards help businesses monitor WHAT is happening to their KPIs. However, if one has to understand the WHY, the path is not so easy. It involves a process known as Root Cause Analysis (RCA) - a concept first developed by Sakichi Toyoda in 1958 as a part of Toyota’s manufacturing process and since then widely adopted across industries as a way to identify the WHY. Currently, the RCA process involves weeks of manual work and coordination across multiple teams - business, product, analytics, data engineering, and systems to identify the event that could have caused a spike or drop in a KPI. Modern Business intelligence tools now come with Auto-RCA capabilities, which help users monitor their metrics in the context of other events across different parts of the organization. Correlating and tracing the changes in metrics and events using AI/ML, it's now possible to instantly figure out the root cause for an outage hence significantly reducing the Mean Time to Resolve (MTTR).
#7 Action Items
Identifying the root cause of an event or an outage is not enough. Most teams then need to correctly identify the action items in order to fix the underlying issue. Modern Business Intelligence tools not only uncover potential root causes but also auto-suggest Action Items that can then be assigned to respective team-owners, thereby aiding decision making within the organization. For example, if there's a spike in Ad Conversions from a certain campaign, a modern Business Intelligence tool not only identifies the hidden trend in real-time but also alerts the respective owner with a suggestion to scale the campaign on a broader set of users.
Chaos Genius is an open-source business observability platform that works seamlessly with your current BI tools to bring augmented analytics to your doorsteps. Check out and access our GitHub Repository here and upgrade to modern Business Intelligence tools today!