


You are likely already familiar with Snowflake—the scalable, cloud data warehouse. But you might be less familiar with Grafana—an open source data visualization platform that unifies queries, charts, graphs and alerts into one easy-to-interpret dashboard. Grafana can connect to various data sources like Snowflake to visualize metrics and set up real-time monitoring.
In this article, we'll provide a detailed guide to configure Grafana Snowflake integration for seamless setup. We'll explore the pre-built Snowflake dashboards in Grafana to understand the available metrics/visualizations. We'll also cover how to create custom Snowflake alerts/notification rules so you're notified of data changes. And for those concerned about costs, we've got you covered with an in-depth analysis of pricing, along with tips and best practices to ensure you get the most value for your money.
What is Grafana?
Grafana originated as a dashboard companion to Prometheus—a monitoring system and time series database. It has since evolved to support many data sources, including Snowflake, InfluxDB, Elasticsearch, MySQL, PostgreSQL and more!! This enables users to unify data from across their full infrastructure and application stack into correlated monitoring dashboards.
Grafana allows users to create customizable dashboards that provide real-time visibility into their data. Dashboards support dynamic filters, metric overlays, panel editing, and variable templating. The query editor enables users to write queries to transform, manipulate, and perform ad-hoc analytics on their data. Alert rules can be defined to notify teams about anomalies or thresholds being crossed.
Key Capabilities of Grafana
Grafana, with its rich feature set, has become a really GREAT tool for many organizations. Let's delve into some of its key capabilities that have contributed to its widespread adoption:
- Dynamic/Interactive Dashboards: One of Grafana's standout features is its ability to create dynamic and interactive dashboards. These dashboards can be customized to suit specific needs, ensuring that users always have a clear view of their data. Whether it's adjusting time ranges, applying filters, or overlaying multiple data sets, Grafana's dashboards offer unparalleled flexibility.
- Data Source Integration: Grafana's strength lies in its ability to integrate with a wide range of data sources. From sources like Snowflake, InfluxDB, Elasticsearch, MySQL, PostgreSQL and more, Grafana can pull data from various sources, offering a unified view.
- Powerful Query Editor: Grafana's query editor is a powerful tool that allows users to manipulate and transform data. Whether it's applying mathematical functions, aggregating data, or filtering out specific metrics, the query editor ensures that users can mold the data to fit their specific needs.
- Alerting: In today's fast-paced environment, real-time alerts are crucial. Grafana's alerting feature ensures that users are instantly notified of any anomalies or threshold breaches. These alerts can be customized based on specific criteria and can be integrated with various notification channels like email, Slack, and more.
- Annotations: Annotations in Grafana allow users to overlay events on their graphs. This feature is particularly useful for correlating data with specific incidents or deployments. So by marking these events on the graph, users can easily identify patterns or anomalies associated with them.
- Plugins and Extensions: Grafana's open-source nature has led to the development of a wide range of plugins and extensions. These plugins extend Grafana's capabilities, allowing users to integrate with additional data sources, apply unique visualizations, or even add custom functionalities.
- Authentication and Security: Grafana offers robust authentication and security features. Whether it's integrating with third-party authentication providers like OAuth or LDAP or applying fine-grained access controls, Grafana ensures that data is always secure and accessible only to authorized users.
What is Grafana Cloud?
While Grafana as a standalone platform offers a plethora of features, Grafana Cloud takes it a step further by providing a fully managed observability suite. But what exactly is Grafana Cloud, and how does it differ from the traditional Grafana setup?
Grafana Cloud is a scalable, reliable, and fully managed version of Grafana, designed to alleviate the headache associated with self-hosting. It combines the power of Grafana with additional tools and integrations, offering a one-stop solution for all observability needs.
Also, Grafana Cloud is built with scalability in mind. But perhaps the most significant advantage of Grafana Cloud is its managed nature. Setting up, maintaining, and scaling Grafana can be a complex task, requiring dedicated resources and expertise. Grafana Cloud takes away this complexity by handling all the operational aspects. From automatic updates to security patches, Grafana Cloud ensures that users always have access to the latest and greatest features without any of the associated maintenance overhead.
Prerequisites Requirement for Grafana Snowflake Integration
Before diving into Grafana Snowflake Integration, it's essential to ensure that all prerequisites are met to ensure a smooth and seamless setup. Here are the prerequisites for the Snowflake Grafana Integration:
1) Snowflake Account and Role Configuration:
To scrape Snowflake metrics, a user configured with the ACCOUNTADMIN role is required. If you're not using an ACCOUNTADMIN role, you must have a custom role with access to the SNOWFLAKE.ACCOUNT_USAGE schema. This schema provides essential metrics and data that Grafana will visualize. For more details on configuring roles, you can refer to the Snowflake documentation.
2) Grafana Cloud Account:
Make sure you have a Grafana Cloud account. The Snowflake integration is designed specifically for Grafana Cloud, which offers a managed Grafana service with additional features and integrations.
3) Grafana Agent Installation:
The Snowflake integration uses the Grafana Agent to collect metrics. This agent should be installed and configured correctly to send Snowflake metrics to your Grafana Cloud instance. A key component of the Grafana Agent is the snowflake-prometheus-exporter. This exporter gets metrics from Snowflake and converts them into a format readable by Prometheus and Grafana. The integration allows the exporter and Prometheus/Grafana to work together seamlessly.
5) Account Details and Credentials:
For the Grafana Agent to access Snowflake, you need to provide specific account details and credentials. These include:
- account_name: This is in the format of [organization]-[account]
- username: Your Snowflake username.
- password: Your Snowflake password.
- warehouse: The Snowflake warehouse that will be utilized to run the queries.
- role: This should be ACCOUNTADMIN unless you're using a custom role with the required permissions.
6) Scrape Interval Configuration:
The default scrape_interval for retrieving metrics from Snowflake is 30 minutes, considering Snowflake's extensive metric intervals. Adjust this based on your data granularity requirements.
Once you are all locked in with these prerequisites, you can confidently proceed with the Snowflake Grafana Integration, unlocking powerful visualization and monitoring capabilities for your Snowflake data warehouse.
Step-by-step guide to Configuring the Snowflake Grafana Integration
Configuring the Snowflake Grafana Integration can seem like a daunting task, but with the right steps, it's a straightforward process. In this particular section, we will walk you through the entire process from scratch, ensuring that you can set up this powerful integration with ease.
Step 1—Setting Up Your Snowflake Account
If you don't already have a Snowflake account, head over to the Snowflake and sign up for an account and make sure that the user you plan to use for the integration has the ACCOUNTADMIN role or a custom role with access to the SNOWFLAKE.ACCOUNT_USAGE schema.
Learn more about setting up different roles with access to ACCOUNT_USAGE, check out Snowflake's documentation.
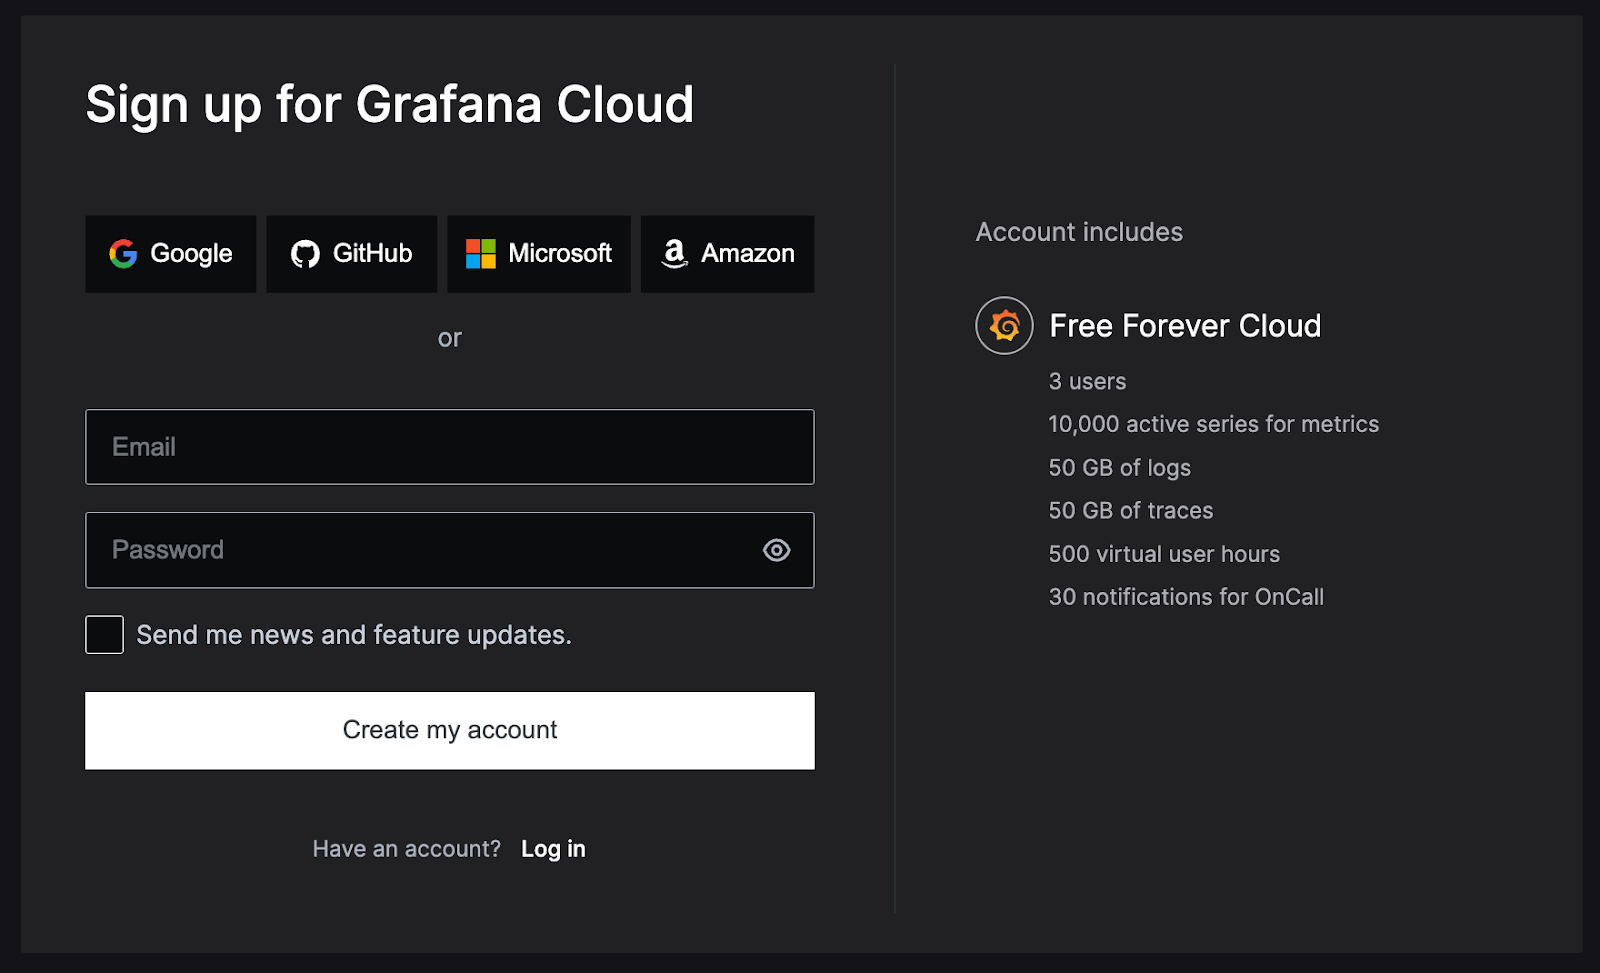
Step 2—Sign Up for Grafana Cloud
Visit the Grafana Cloud website and sign up for an account. Choose a suitable plan based on your needs. For beginners, the free tier might be sufficient.
Step 3—Configuring Grafana Snowflake Integration
Log in to Grafana Cloud and navigate to the home page. Then go to the connection page and add a Snowflake connection.

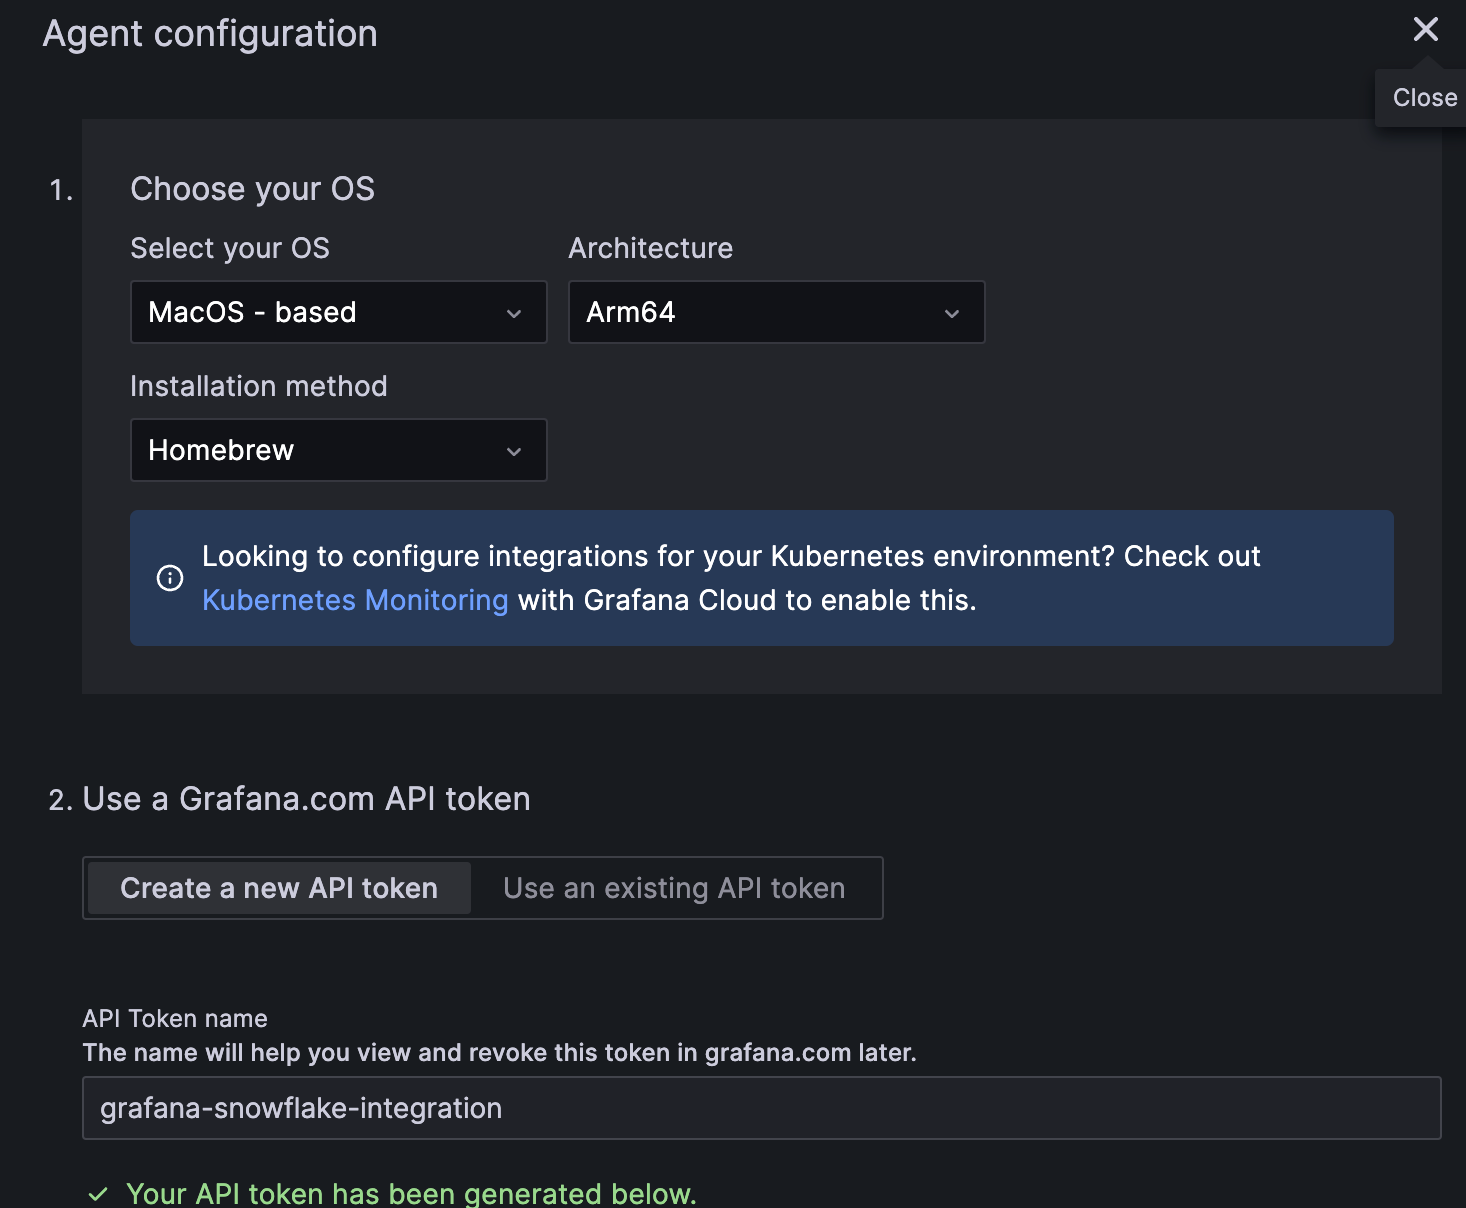
Step 4—Install the Grafana Agent
Download the Grafana Agent for your operating system. For macOS, follow the installation instructions to install the agent. The installation process is similar for Windows and Ubuntu — just follow the provided steps. For this article, we will walk through the macOS installation, but users of other operating systems can follow along as the process is straightforward.
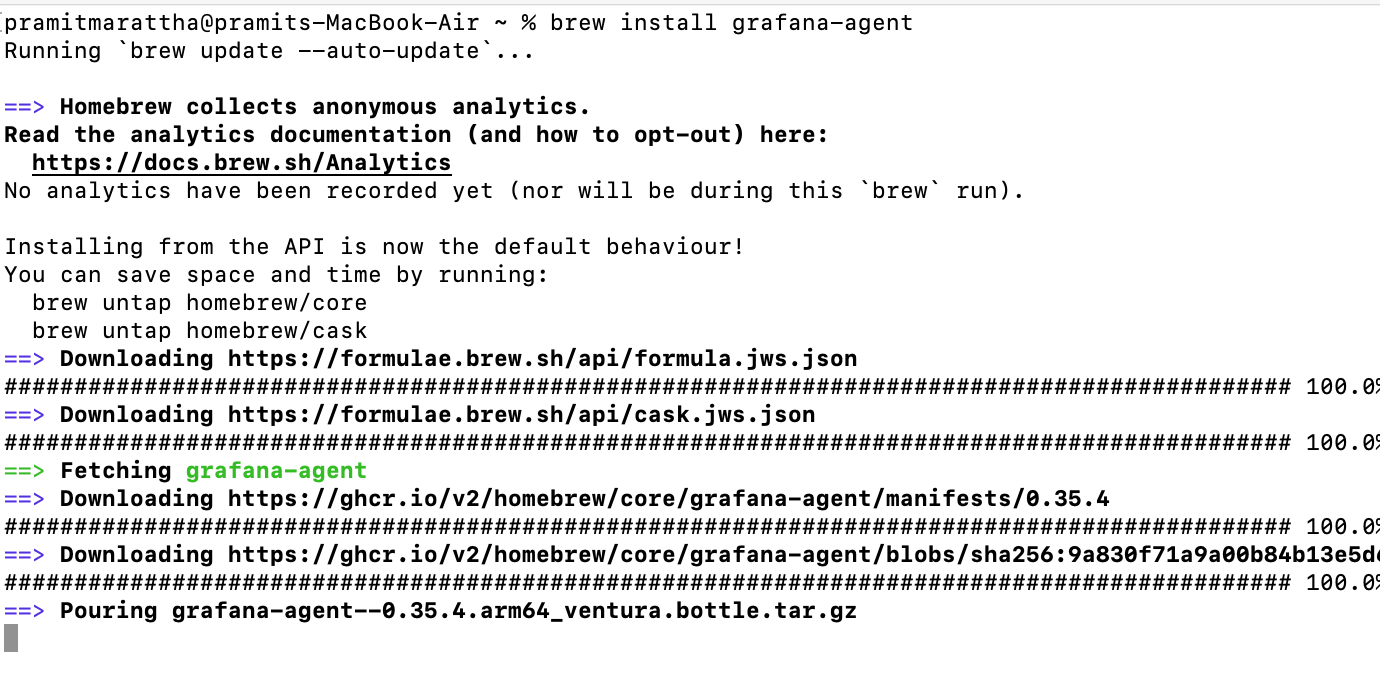
The Grafana Agent can be installed using Homebrew on macOS. To install the latest version with Homebrew, open a new terminal window and run the following command:
brew install grafana-agentThis will install the most recent release of Grafana Agent using the official Homebrew. Alternatively, binary packages are also available if you do not want to use Homebrew.
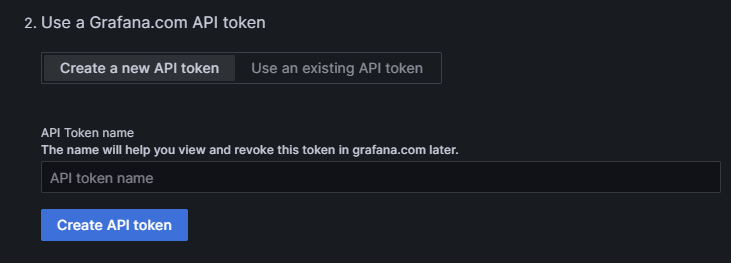
Now, generate an API token that can be used to authenticate the Grafana Agent. Give the token a descriptive name that will help you identify it later on. The name is important — it will allow you to view and revoke the token in your Grafana profile if needed. Be sure to save the API token when it is generated.
ARCH="arm64" GCLOUD_HOSTED_METRICS_URL="https://prometheus-prod-10-prod-us-central-0.grafana.net/api/prom/push" GCLOUD_HOSTED_METRICS_ID="474720" GCLOUD_SCRAPE_INTERVAL="60s"
GCLOUD_HOSTED_LOGS_URL="https://logs-prod3.grafana.net/loki/api/v1/push" GCLOUD_HOSTED_LOGS_ID="236330"
GCLOUD_RW_API_KEY=<API-Token> /bin/sh -c "$(curl -fsSL https://storage.googleapis.com/cloud-onboarding/agent/scripts/grafanacloud-install-darwin.sh)"
After generating the API token, you need to provide the token to the Grafana Agent. Open up your terminal and run the above command, replacing <API-token> with your actual API token. This will configure the Grafana Agent with the API token, allowing it to authenticate with Grafana.
Note: Make sure to replace <API-token> with the actual token string you generated in the previous step.

Step 5—Start the Grafana Agent
After configuring the API token, start the Grafana Agent. On macOS, you can run the agent as a background service using Homebrew:
brew services start grafana-agentThis process will start the Grafana Agent in the background. Verify that it starts up without any errors. The Grafana agent can now run continuously as a service, allowing it to monitor and collect metrics from the system. Other operating systems also have similar commands to start the agent as a persistent service.
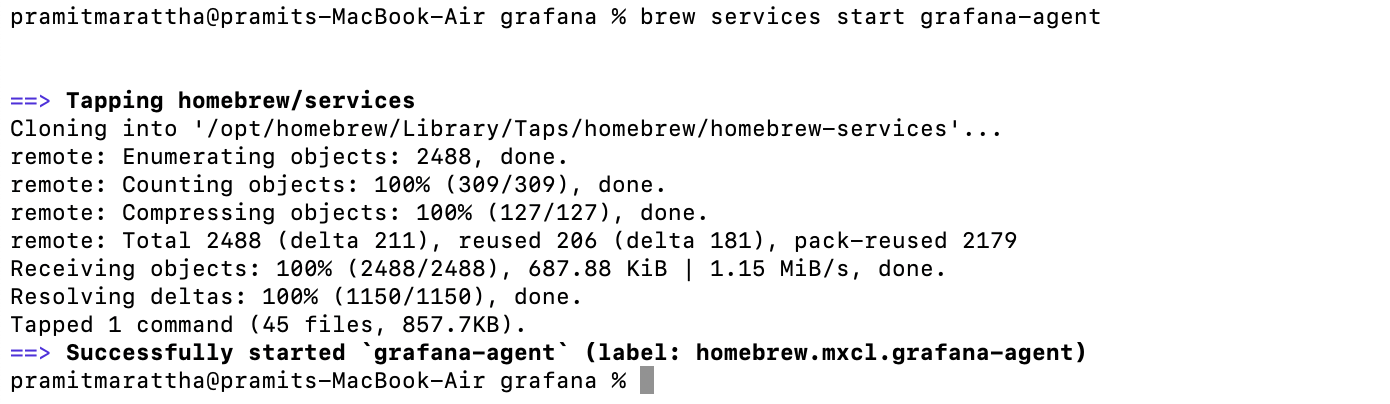
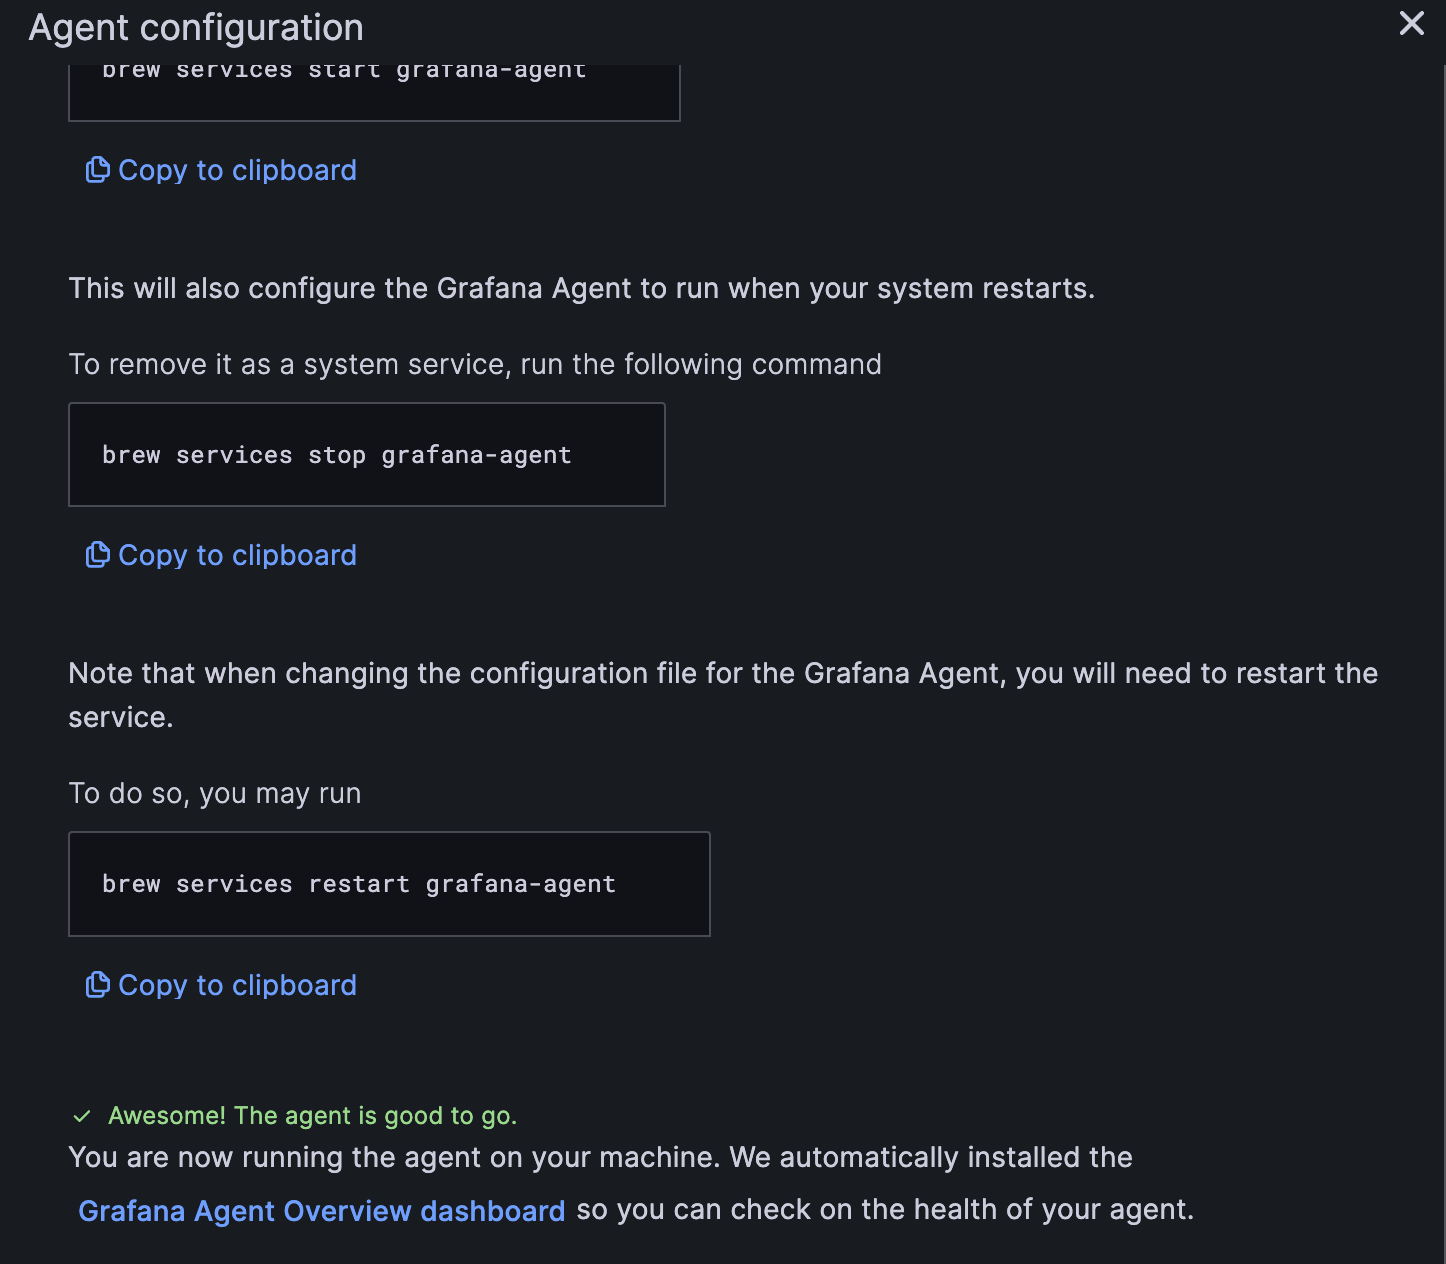
This will also configure the Grafana Agent to run when your system restarts.
To stop the Grafana Agent running as a background service on macOS, you can use the following command:
brew services stop grafana-agentThis will remove the agent from running as a persistent system service. The agent process will be shut down.
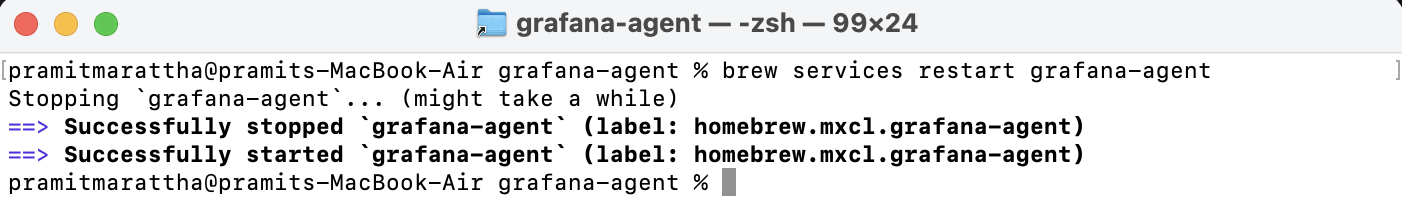
If you modify the configuration file for the Grafana Agent, you need to restart the service for the changes to take effect.
On macOS, you can restart the background service using:
brew services restart grafana-agentThis will restart the agent and load the latest configuration. Make sure to restart the service whenever you update the config file.
Step 6—Test the Grafana agent connection
After installing and configuring the Grafana Agent, you can test that it is communicating properly with Grafana Cloud. Click the "Test Connection" button. If it succeeds, you will see a green success message saying "Awesome! The agent is good to go." This verifies that the agent is able to connect to the Grafana Cloud service properly.
Step 7—Configure the Grafana Agent for Snowflake
To configure the Grafana Agent, you need to edit the config.yml file.
On macOS, you can create the file by running:
touch $(brew --prefix)/etc/grafana-agent/config.ymlThen open the file for editing:
$(brew --prefix)/etc/grafana-agent/config.yml
In this file, add configuration blocks based on your specific telemetry needs. Refer to the Grafana documentation on configuring the agent for more details.
The config file allows you to specify what metrics and logs the agent should collect. Tailor the configuration to your requirements. Be sure to restart the agent after making any changes to the file.
The config.yml file provides a centralized way to control and configure your Grafana Agent setup.
To configure the Grafana Agent to collect metrics from Snowflake, add the following snippet to the config.yml file:
snowflake:
  enabled: true
  scrape_interval: 30m
  scrape_timeout: 1m
  scrape_integration: true
  account_name: "<your_snowflake_account_name>"
  username: "<your_snowflake_username>"
  password: "<your_snowflake_password>"
  warehouse: "<your_snowflake_warehouse>"
  role: "ACCOUNTADMIN" # or your custom role
Make sure to replace the placeholder values enclosed in <> with your actual Snowflake account credentials and configuration. The scrape_interval is set to 30m by default. Lower intervals may increase costs in Snowflake. This configuration will allow the Grafana Agent to connect to Snowflake and collect performance metrics. Customize the config as needed for your environment.
Below is a full example Grafana Agent configuration containing integration snippets for collecting metrics from Snowflake.
integrations:
  prometheus_remote_write:
  - basic_auth:
      password: <your_prom_pass>
      username: <your_prom_user>
    url: <your_prom_url>
  agent:
    enabled: true
    relabel_configs:
    - action: replace
      source_labels:
      - agent_hostname
      target_label: instance
    - action: replace
      target_label: job
      replacement: "integrations/agent-check"
    metric_relabel_configs:
    - action: keep
      regex: (prometheus_target_.*|prometheus_sd_discovered_targets|agent_build.*|agent_wal_samples_appended_total|process_start_time_seconds)
      source_labels:
      - __name__
  # Add here any snippet that belongs to the `integrations` section.
  # For a correct indentation, paste snippets copied from Grafana Cloud at the beginning of the line.
  snowflake:
    enabled: true
    scrape_interval: 30m
    scrape_timeout: 1m
    scrape_integration: true
    account_name: "SNOWFLAKE_ACCOUNT"
    username: "SNOWFLAKE_USERNAME"
    password: "SNOWFLAKE_PASSWORD"
    warehouse: "SNOWFLAKE_WAREHOUSE"
    role: "ACCOUNTADMIN"
logs:
  configs:
  - clients:
    - basic_auth:
        password: <your_loki_pass>
        username: <your_loki_user>
      url: <your_loki_url>
    name: integrations
    positions:
      filename: /tmp/positions.yaml
    scrape_configs:
      # Add here any snippet that belongs to the `logs.configs.scrape_configs` section.
      # For a correct indentation, paste snippets copied from Grafana Cloud at the beginning of the line.
metrics:
  configs:
  - name: integrations
    remote_write:
    - basic_auth:
        password: <your_prom_pass>
        username: <your_prom_user>
      url: <your_prom_url>
    scrape_configs:
      # Add here any snippet that belongs to the `metrics.configs.scrape_configs` section.
      # For a correct indentation, paste snippets copied from Grafana Cloud at the beginning of the line.
  global:
    scrape_interval: 60s
  wal_directory: /tmp/grafana-agent-wal
As you can see, Snowflake integration can be combined with other data sources in the Grafana Agent configuration file. Make sure to fill in the required credentials and details. Refer to the Grafana docs for more configuration examples.
Step 8—Save and Close the Configuration
After adding the required configuration snippets to the Grafana Agent config file, the next step is to save the file and restart the agent for the changes to take effect.
On macOS, you can restart the agent background service by running:
brew services restart grafana-agentThis will shutdown and restart the agent, loading the latest configuration from config.yml.
Note: Always remember to restart the agent anytime you edit the config file. The agent process needs to be restarted to pick up any configuration changes.
Once restarted, you can verify that the new configurations are working as expected by checking metrics and logs are being collected properly. Restarting and testing is crucial to validate your config changes.
Step 9—Verify the Grafana Snowflake Integration
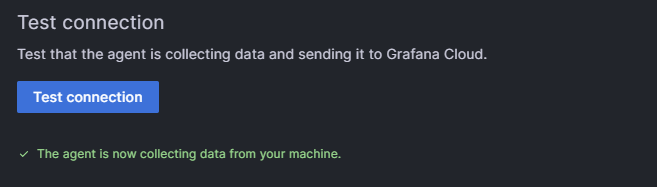
Go back to the Snowflake data source page in Grafana cloud. At the bottom there is a "Test Connection" button that can be used to validate that the agent is able to connect and collect metrics from Snowflake.
Click the "Test Connection" button. If it fails, double check your configuration (config.yml), fix any issues, and restart the agent again. If the connection test succeeds, you will see a green success message indicating that the agent can now pull metrics from Snowflake.

Step 10—Install Dashboards and Alerts
Finally, to complete the integration, you need to install the pre-built dashboards and alerts for Snowflake into your Grafana Cloud instance.
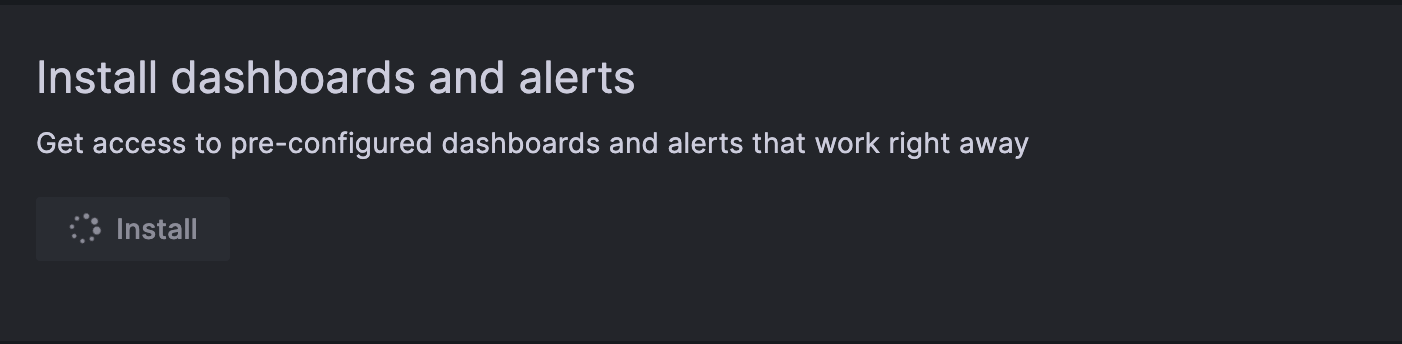
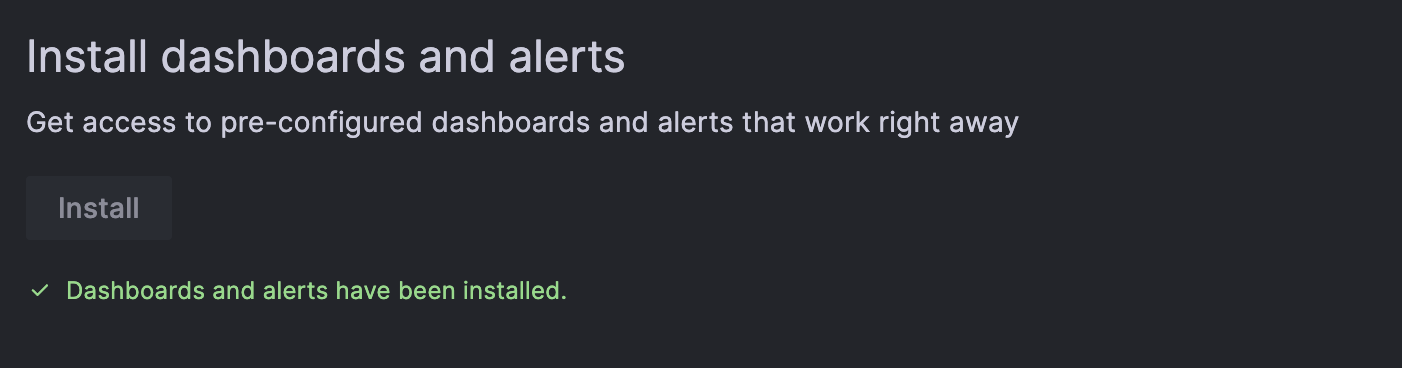
Scroll down to the Snowflake integration page again. You will see an "Install" button - click this to install the packaged dashboards and alerts.
This will automatically add pre-configured Snowflake dashboards and alerts that work right away in your Grafana Cloud. The dashboards provide metrics and visualizations for monitoring Snowflake, while the alerts allow you to set up notification rules on critical metrics.
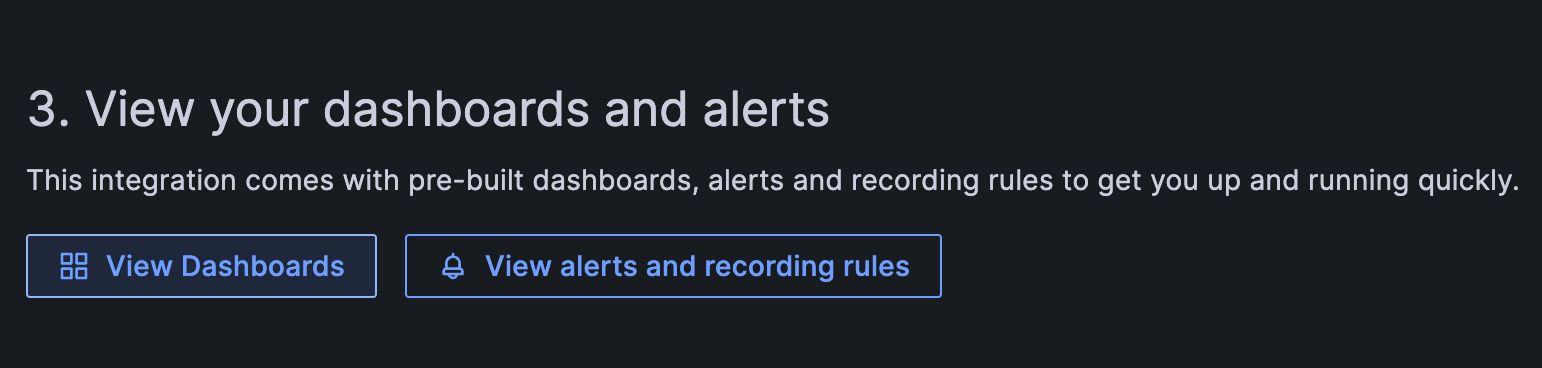
Step 11—View the Dashboards and Alerts
Once the Snowflake integration is installed, go to the Dashboards section in Grafana Cloud. Open the Snowflake dashboards and verify that metrics data from your Snowflake account is being visualized correctly.
Review the various dashboard panels to ensure they are displaying metrics as expected. This validates that the Grafana Agent is collecting Snowflake metrics properly based on your configuration.
Also, check that the alert rules are working by verifying you receive notifications when alert conditions are triggered.
Step 12—Fine-tuning and Customization
Once the Snowflake dashboards are installed, you can customize them as needed:
- Add or remove panels from the dashboards based on your monitoring requirements.
- Add additional Snowflake metrics to track by modifying the configuration, allowing you to fully monitor other features as needed.
- Adjust alert thresholds on the dashboards to match your specific operational needs.
Note: You can also change the scrape_interval in the Grafana Agent config to increase or decrease the frequency of metric collection from Snowflake.
Step 13—Secure Your Integration
As a final step, make sure to follow security best practices for the Snowflake-Grafana integration:
- The Snowflake password used in the Grafana Agent config should be stored and handled securely. Avoid checking it into source control.
- Regularly rotate the Snowflake password and any API keys used by the integration. This limits exposure if credentials are compromised.
- Monitor access logs in Snowflake and Grafana Cloud to detect any unauthorized login attempts or suspicious activity.
- Lock down Snowflake and Grafana Cloud permissions to the minimum required for what the agent needs access to.
- Consider using short-lived credentials if possible.
Pre-built Snowflake Dashboards Provided by Grafana
Let's take another look at the pre-built Snowflake dashboards included with the integration. These dashboards provide a starting point for monitoring your Snowflake usage.
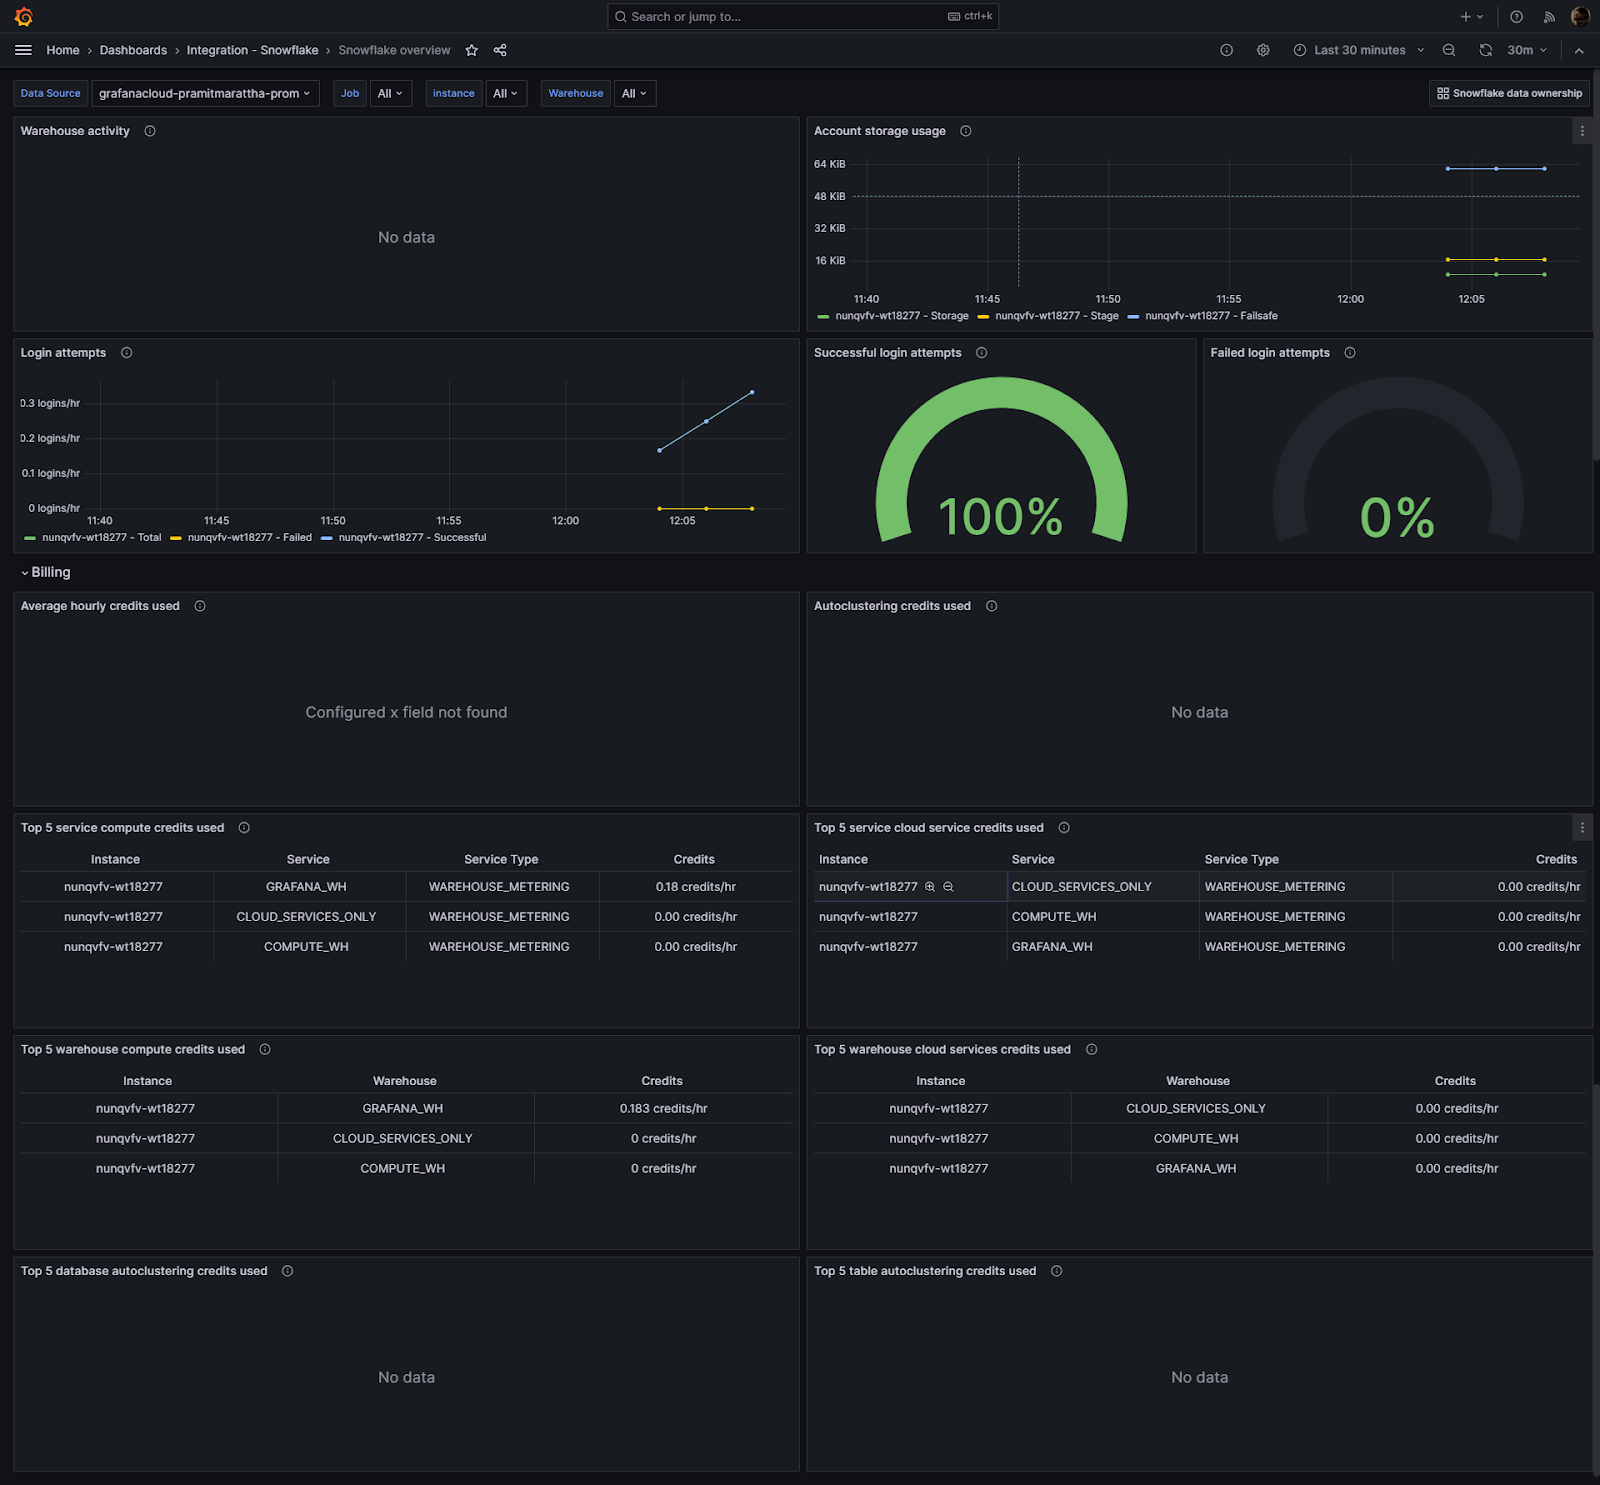
The overview dashboard surface key metrics to track like jobs, instances, and warehouses. You can select specific jobs, instances, or warehouses from the top dropdowns to filter the metrics displayed. This allows drilling down into specific areas as needed. The dashboards can also be set to display metrics for your entire Snowflake account. In addition to the pre-built dashboards, all the metrics being collected by the integration are available for you to explore and use to build custom dashboards and alerts tailored to your needs.

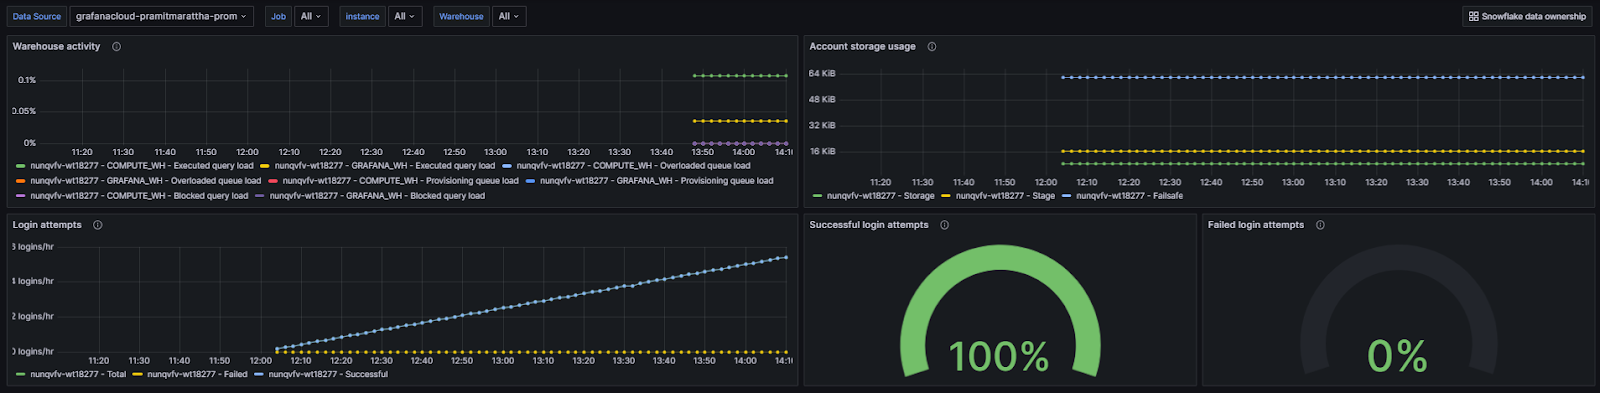
1) Snowflake dashboard Overview—Account usage, warehouse, and login activity
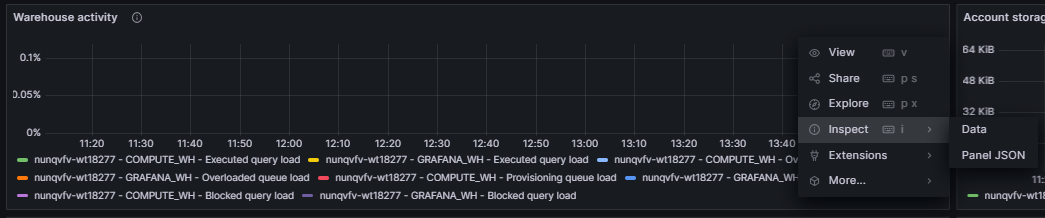
Let's look at the top section of the dashboard. Here you can see:
- Warehouse query activity for the warehouse selected in the Warehouse selector
- Account storage usage - this shows data storage used for the entire account
- Login attempt rate over the past 24 hours
- Percentage of total login attempts that were successful
- Percentage of total login attempts that failed
Key Snowflake metrics that are monitored by default in this particular section include:
- snowflake_warehouse_executed_queries - Number of queries executed on a warehouse
- snowflake_warehouse_blocked_queries - Number of queries blocked on a warehouse
- snowflake_login_rate - Rate of login attempts to Snowflake
- snowflake_failed_login_rate - Rate of failed login attempts
This section provides an overview of key warehouse activity, account usage, and login metrics for your Snowflake account.
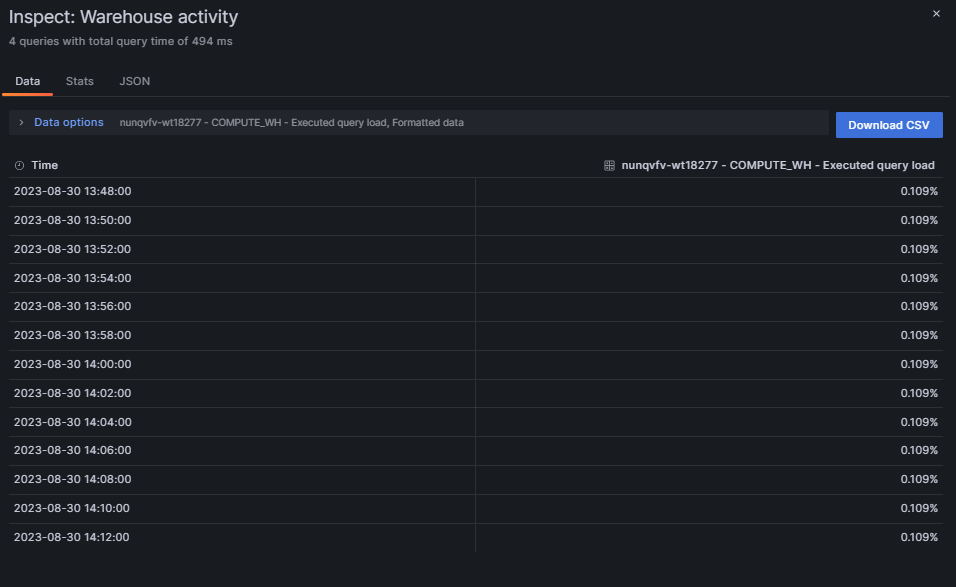
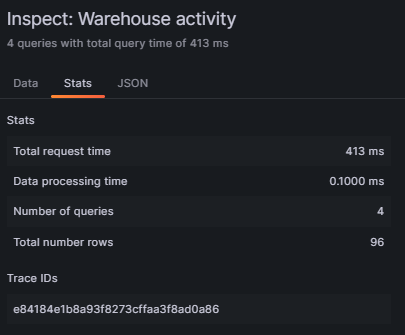
The dashboards you see are customizable — you can edit individual panels to change what data is displayed.
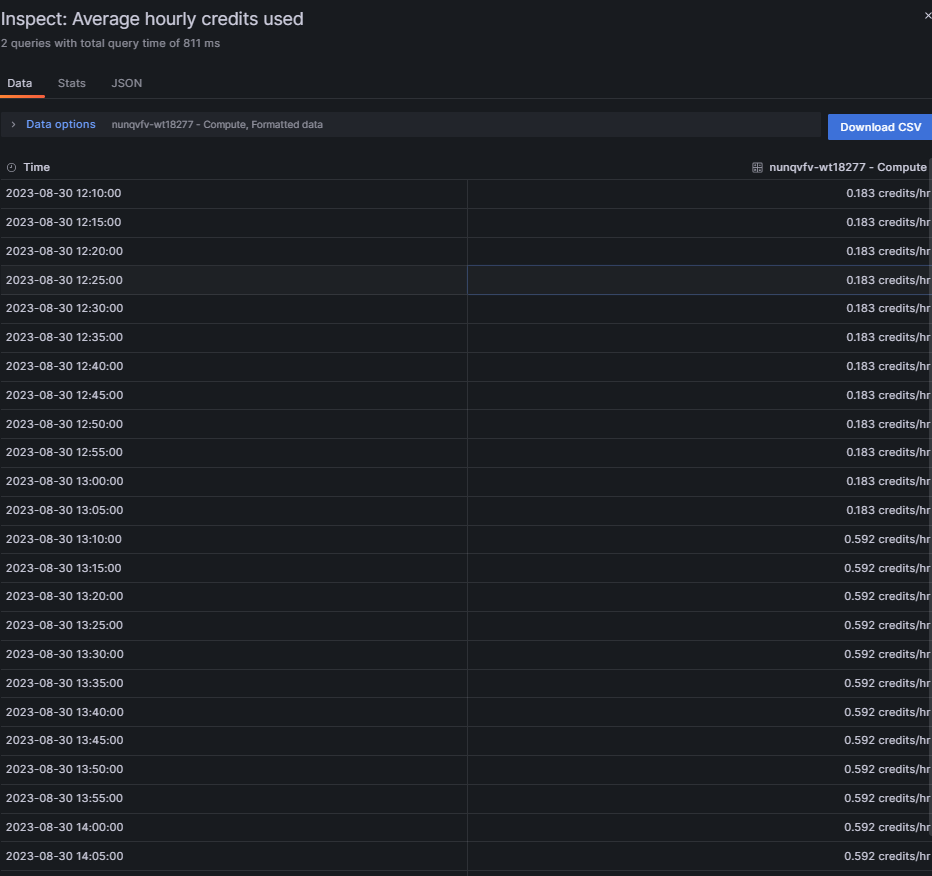
To customize a panel, click on the three dots icon in the top right of the panel. This opens a menu - select "Inspect" to see the details of that particular metrics. You can even the the entire status of that particular metrics.
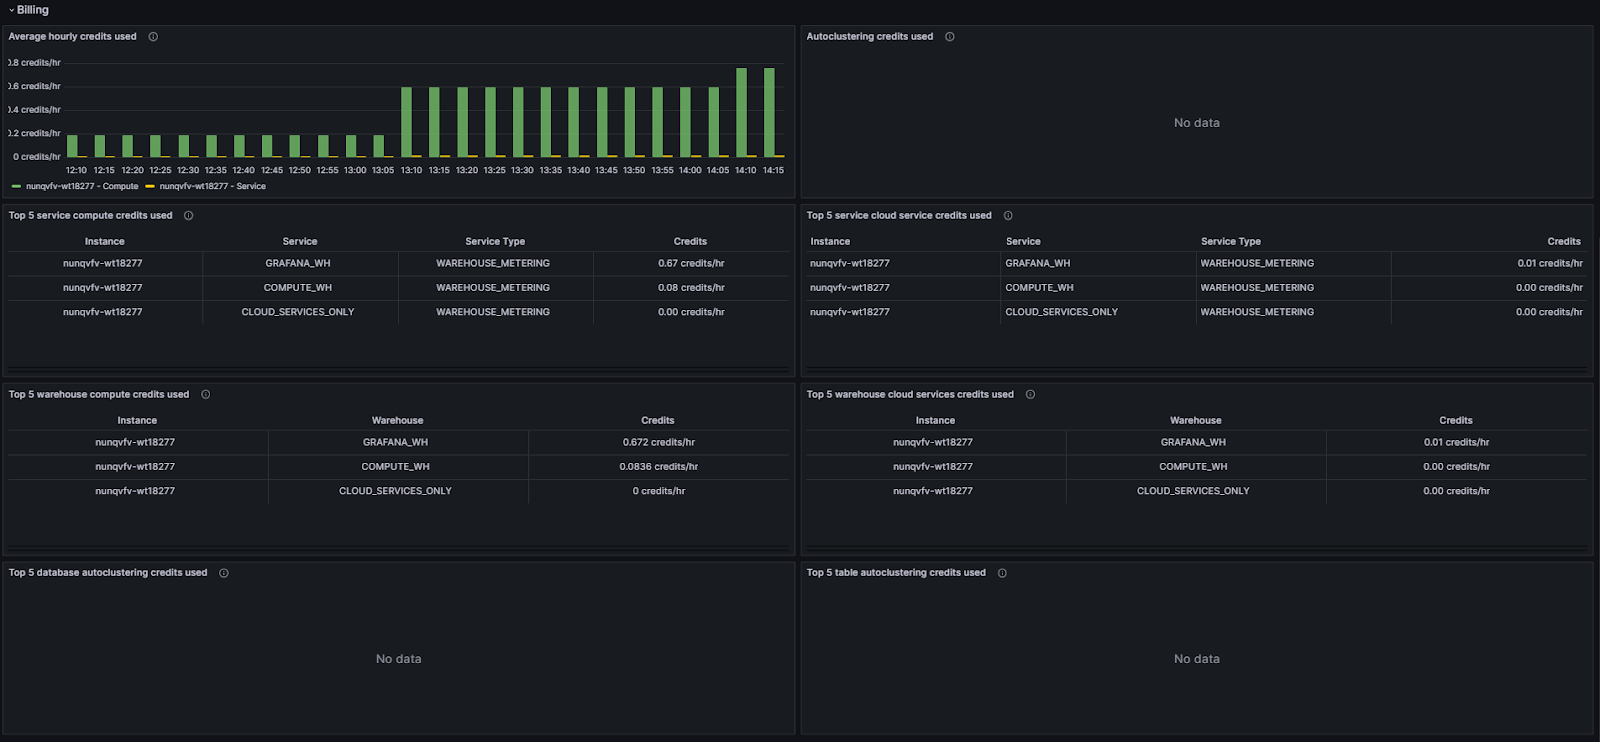
2) Snowflake dashboard Overview—Snowflake billing usage
Let's look at the bottom section of the dashboard. Here you can see detailed usage and cost metrics such as:
- Average hourly credits used – Shows the number of billing credits used for the account.
- Auto Clustering credits used – Credits billed for automatic reclustering.
- Top 5 service compute credits used – Shows the top 5 services with the highest compute usage.
- Top 5 service cloud service credits used – Shows the top 5 services with the highest cloud service usage.
- Top 5 warehouse compute credits used – Shows the top 5 warehouses with highest compute usage.
- Top 5 warehouse cloud services credits used – Shows the top 5 warehouses with highest cloud services usage.
- Top 5 database autoclustering credits used – Shows the top 5 databases by auto clustering credits.
- Top 5 table auto clustering credits used – Shows the top 5 tables by auto clustering credits.
This provides complete visibility into Snowflake usage and costs at both the account and warehouse levels.
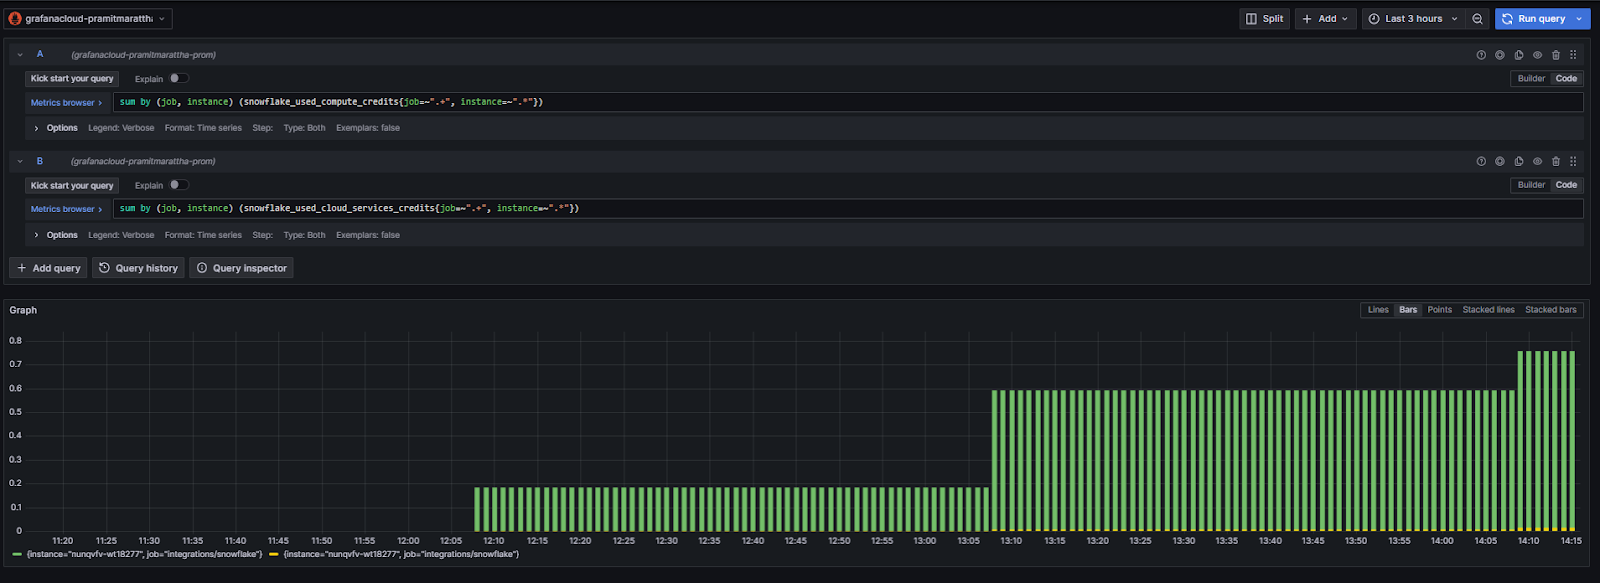
key Snowflake metrics that are monitored by default in this particular section include:
- snowflake_used_compute_credits - Compute credits used by the account
- snowflake_used_cloud_services_credits - Cloud services credits used by the account
- snowflake_warehouse_used_cloud_service_credits - Cloud services credits used per warehouse
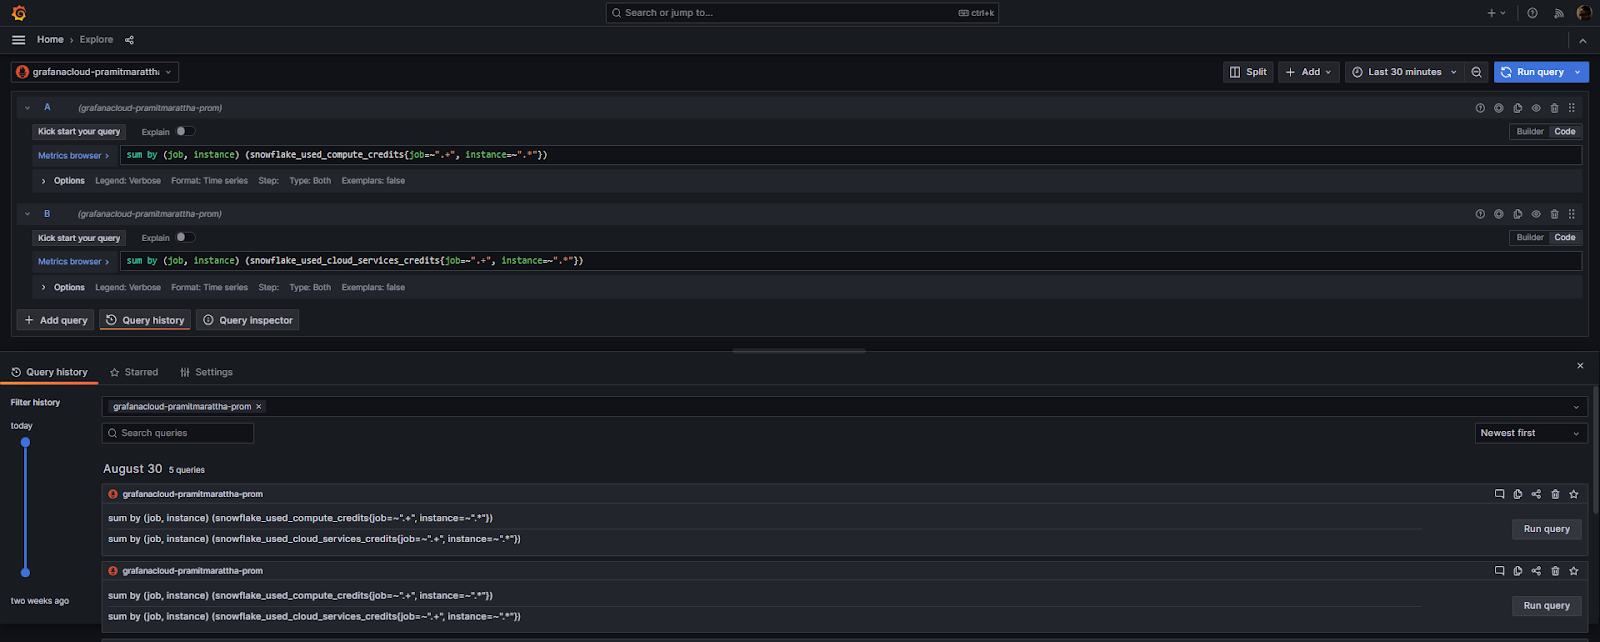
You see that these are also fully customizable — you can edit individual panels to change what data is displayed.

To customize metrics, click on the three dots icon in the top right of the panel. This opens a menu - select "Explore" to modify the metrics.
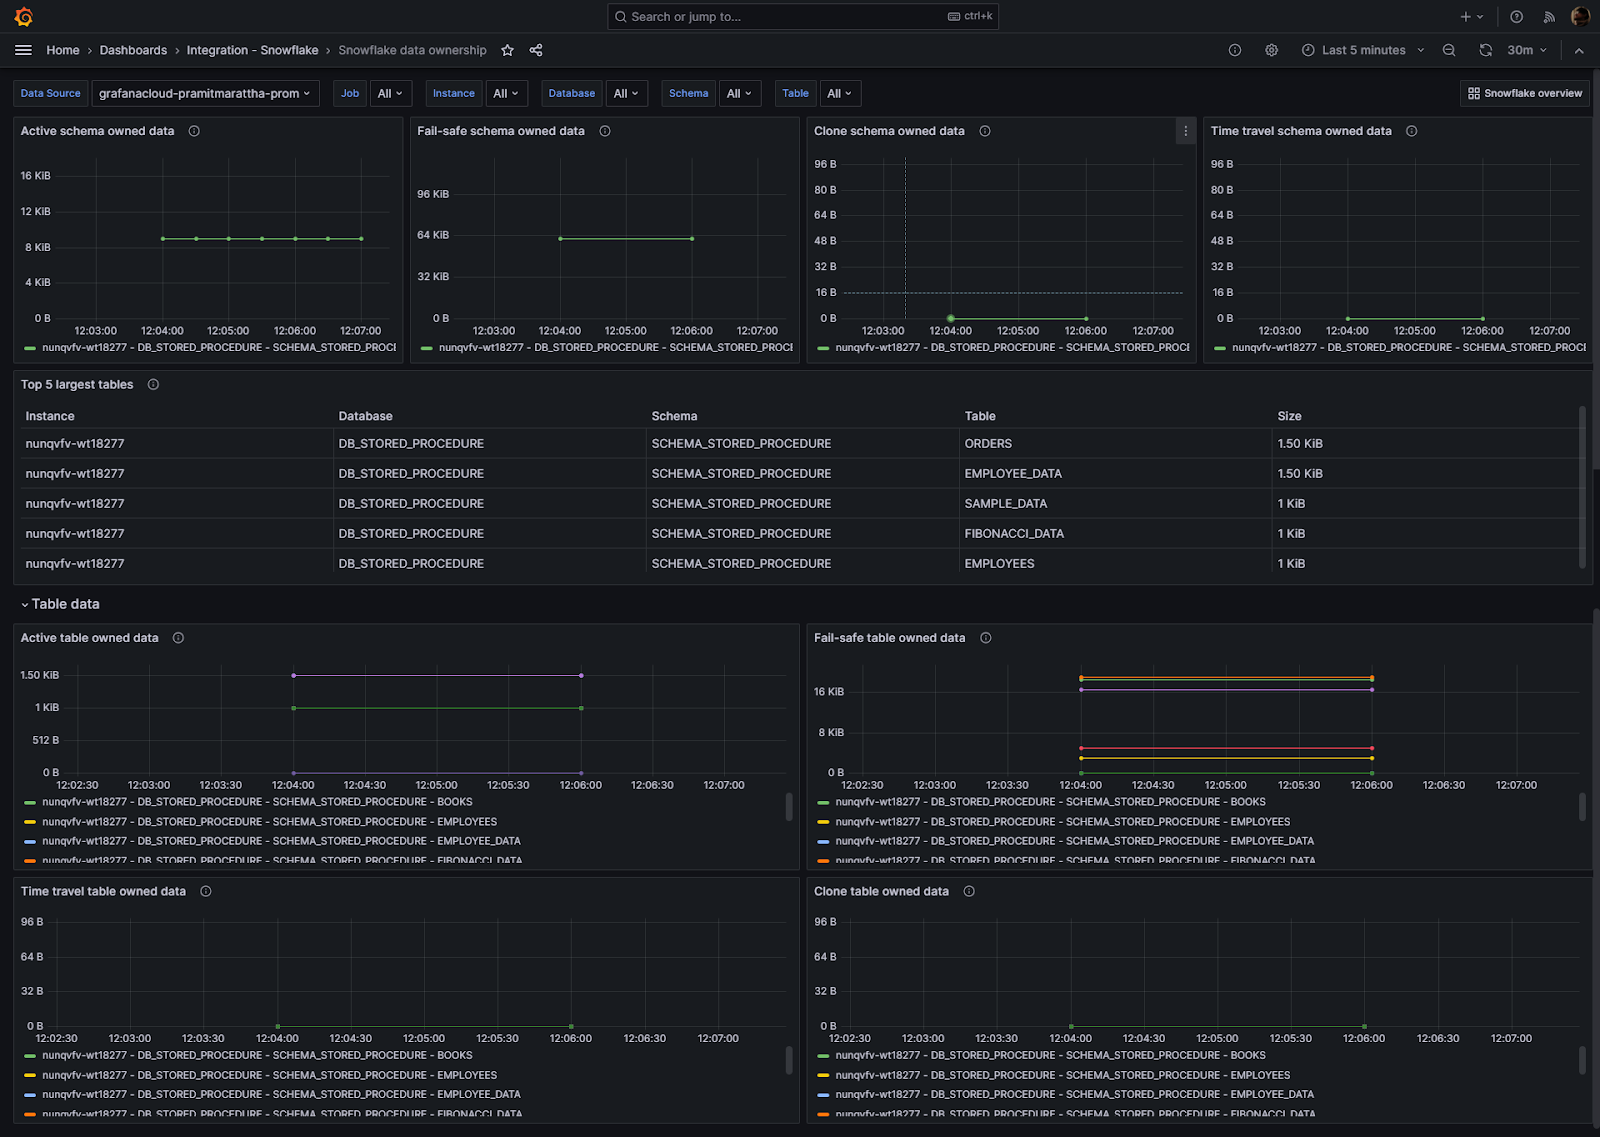
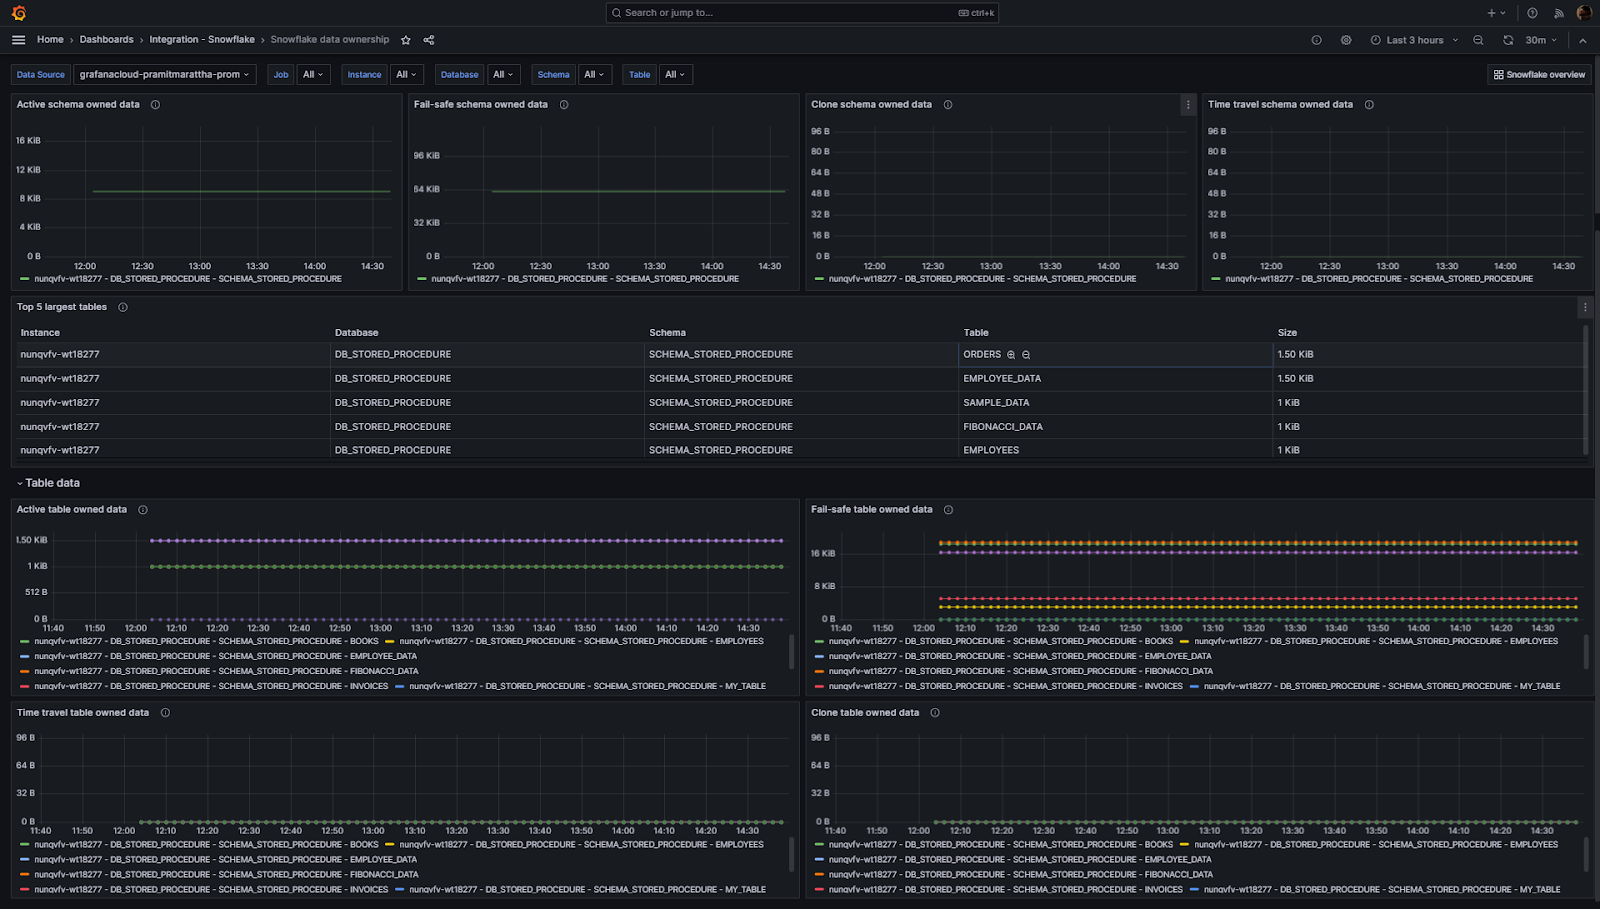
3) Snowflake dashboard Overview—Data Ownership Dashboard
Now, let's dive into the ownership dashboard. This dashboard provides you with a dedicated insight on used storage for schema and tables in your Snowflake Data Cloud. It measures the following metrics such as: Active schema owned data, Fail-safe schema owned data, Clone schema owned data, Time travel schema owned data, Top 5 largest tables, Active table owned data, Fail-safe table owned data, Time travel table owned data, and Clone table owned data
Now, let's dive into the Ownership dashboard. This dashboard provides insights into storage usage for schemas and tables in Snowflake.
- Active schema owned data - Storage used for active table data per schema
- Fail-safe schema owned data - Storage for fail-safe table data per schema
- Clone schema owned data - Storage for cloned table data per schema
- Time travel schema owned data - Storage for time travel table data per schema
- Top 5 largest tables - Top tables by storage usage
- Active table owned data - Active storage per table
- Fail-safe table owned data - Fail-safe storage per table
- Time travel table owned data - Time travel storage per table
- Clone table owned data - Cloned storage per table
key Snowflake metrics that are monitored by default in this particular section include:
- snowflake_table_active_bytes - Active storage used per table
- snowflake_table_time_travel_bytes - Time travel storage per table
- snowflake_table_failsafe_bytes - Fail-safe storage per table
- snowflake_table_clone_bytes - Clone storage per table
This provides visibility into Snowflake storage consumption at both the schema and table level.
Snowflake Metrics Included in Pre-Built Grafana Connection
Here is the list of all the metrics included in the pre-built Grafana connection that you can play around with:
- snowflake_auto_clustering_credits: Sum of credits billed for automatic reclustering in last 24 hours
- snowflake_failed_login_rate: Rate of failed logins per hour in last 24 hours
- snowflake_failsafe_bytes: Bytes of data in Fail-safe
- snowflake_login_rate: Rate of logins per hour in last 24 hours
- snowflake_stage_bytes: Bytes of stage storage used by files in all stages
- snowflake_storage_bytes: Bytes of table storage used, including Time Travel
- snowflake_successful_login_rate: Rate of successful logins per hour in last 24 hours
- snowflake_table_active_bytes: Sum of table's active bytes
- snowflake_table_clone_bytes: Sum of table's cloned bytes
- snowflake_table_failsafe_bytes: Sum of table's bytes in Fail-Safe
- snowflake_table_time_travel_bytes: Sum of table's bytes in Time Travel
- snowflake_up: Metrics that indicates the status of the exporter collection. 1 if connection succeeded, 0 otherwise
- snowflake_used_cloud_services_credits: Avg credits billed for cloud services in last 24 hours
- snowflake_used_compute_credits: Avg credits billed for warehouses in last 24 hours
- snowflake_warehouse_blocked_queries: Avg load of blocked queries in last 24 hours
- snowflake_warehouse_executed_queries: Avg query load in last 24 hours
- snowflake_warehouse_overloaded_queue_size: Avg load of overloaded queries in last 24 hours
- snowflake_warehouse_provisioning_queue_size: Avg load of provisioning queries in last 24 hours
- snowflake_warehouse_used_cloud_service_credits: Avg warehouse credits for cloud services in last 24 hours
- snowflake_warehouse_used_compute_credits: Avg warehouse credits in last 24 hours
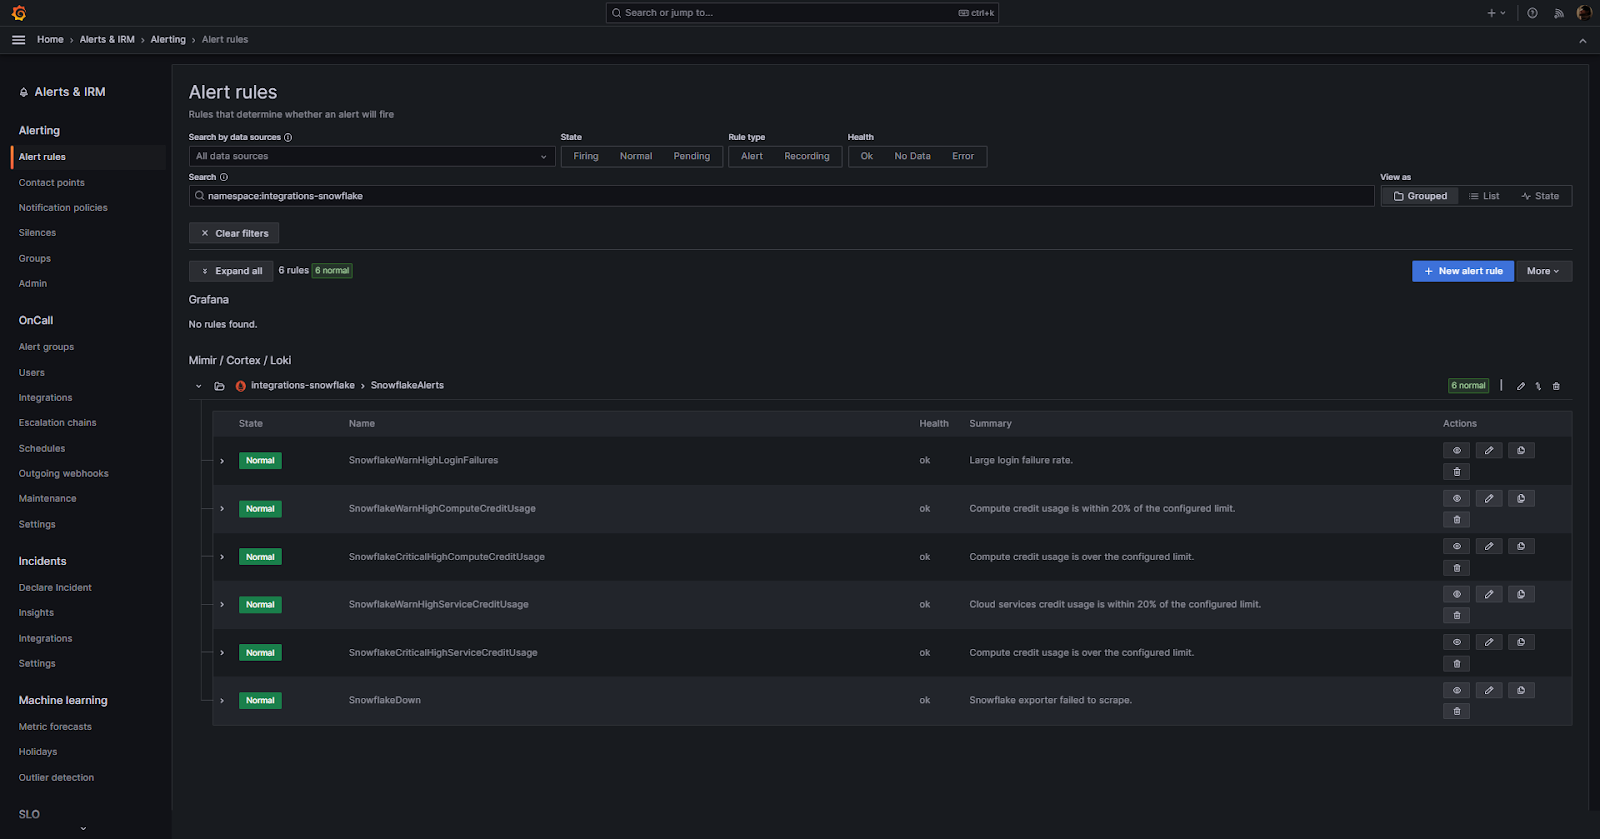
Snowflake Alerts and Notification Rules in Grafana Dashboard
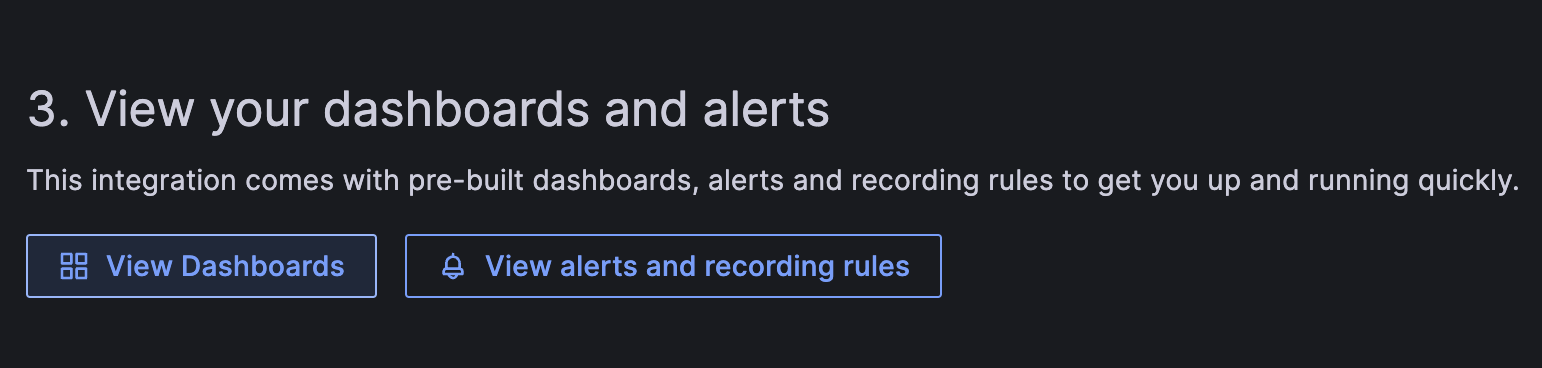
Finally, let's look at how you can set alerts and notifications in Grafana. To do so, all you have to do is navigate to the bottom section of the configuration section where you can see an option called "View alerts and recording rules". Click on it and then you will be redirected to a separate page where you can set the alert rules that determine whether an alert will fire.
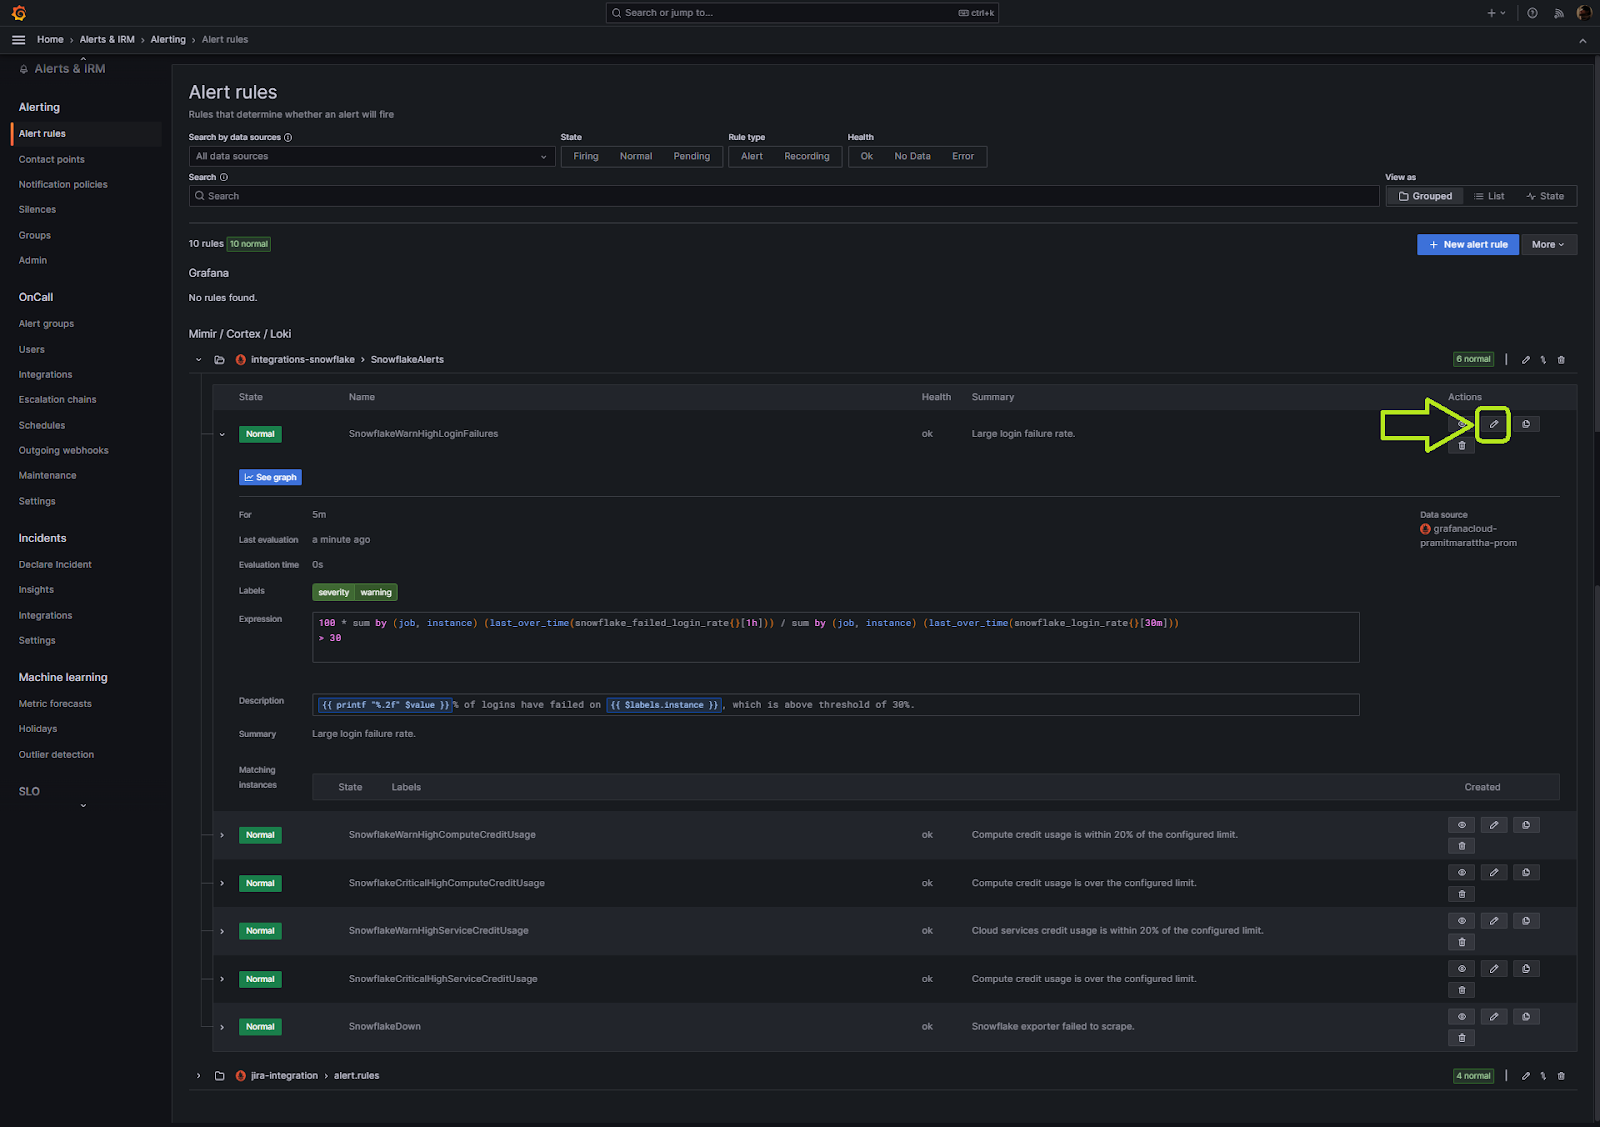
Alert rules determine when an alert will fire based on metric thresholds. This integration includes 6 preset alert rules you can view and edit:
- SnowflakeWarnHighLoginFailures - Fires when login failure rate is high
- SnowflakeWarnHighComputeCreditUsage - Fires when compute credit usage nears configured limit
- SnowflakeCriticalHighComputeCreditUsage - Fires when compute credit usage exceeds configured limit
- SnowflakeWarnHighServiceCreditUsage - Fires when cloud services credit usage nears configured limit
- SnowflakeCriticalHighServiceCreditUsage - Fires when cloud services credit usage exceeds configured limit
- SnowflakeDown - Fires when Snowflake exporter fails to collect metrics
You can customize the conditions, thresholds, and notifications for these alerts in the Grafana Alerting section.

Configuring Alert Thresholds
You can easily customize the alert thresholds in Grafana. To edit the threshold for an alert rule, simply click on the pencil icon next to the rule.
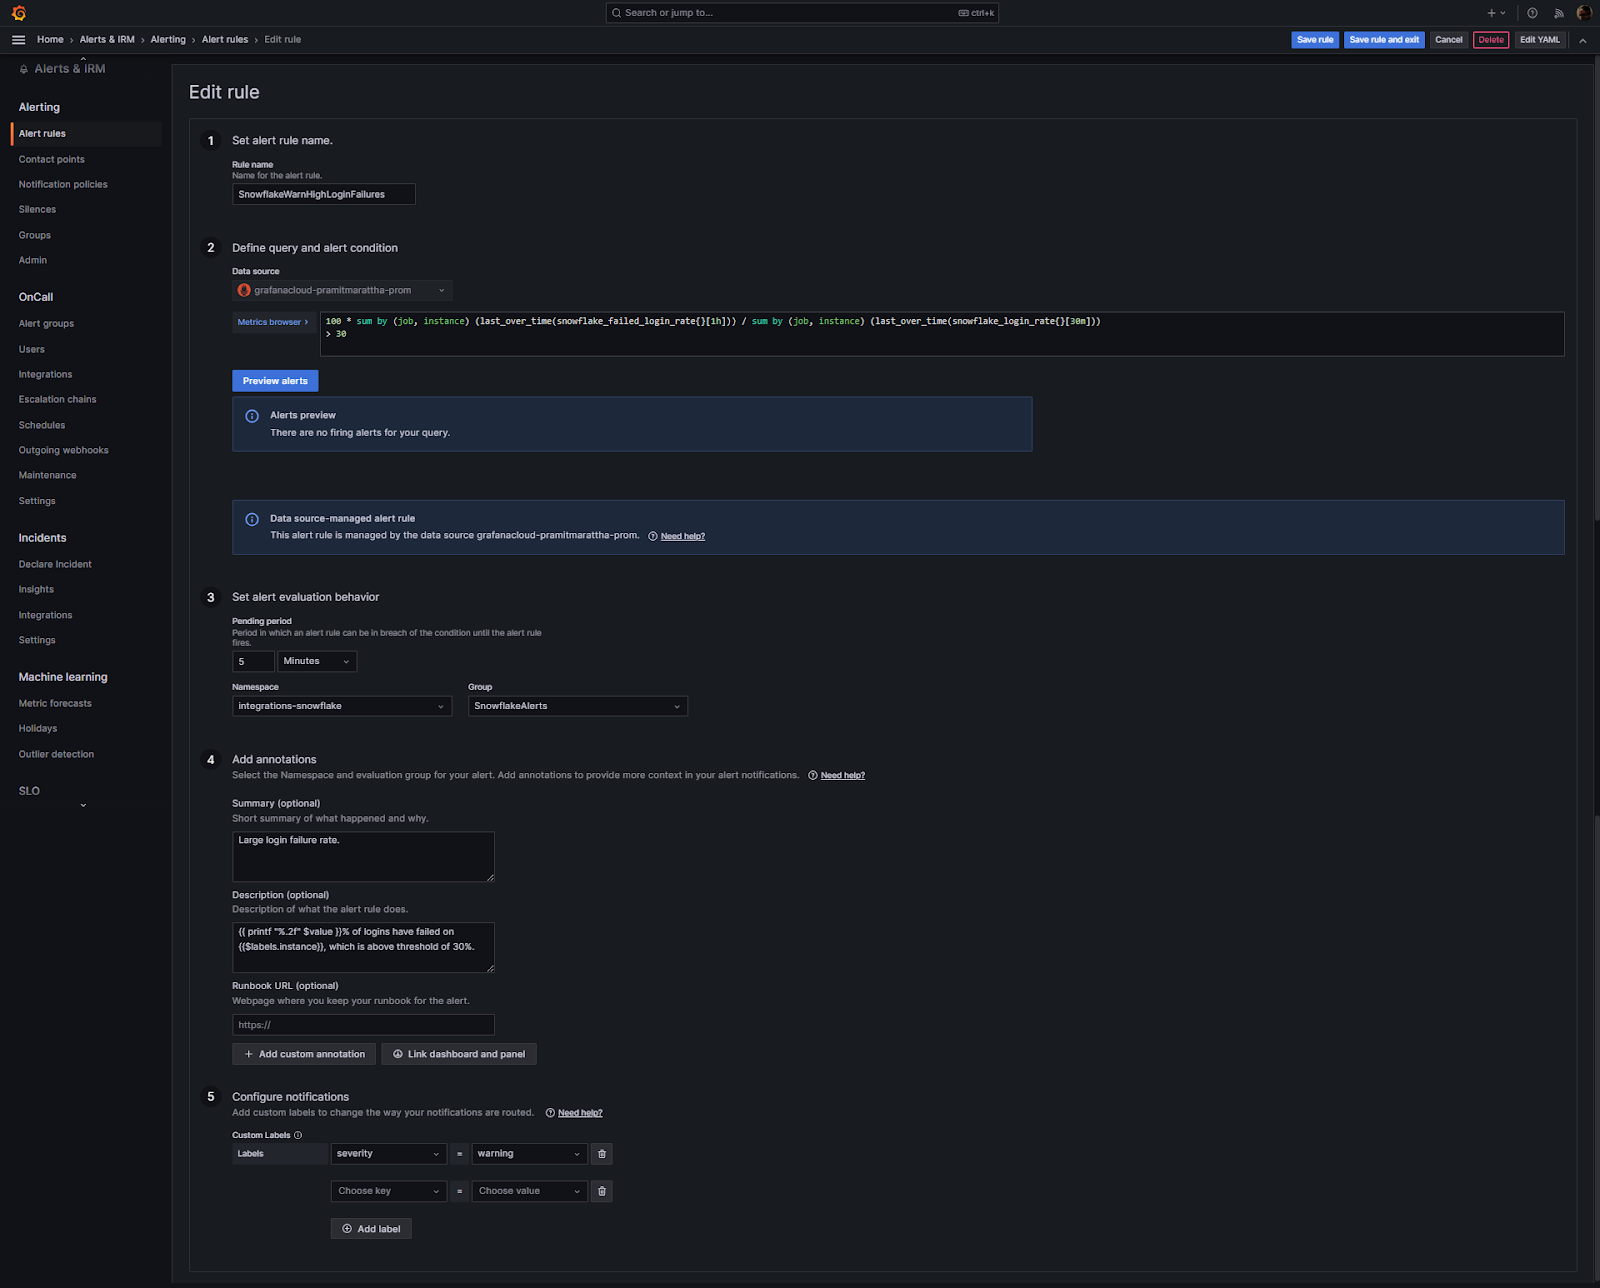
As you can see, this will open the edit menu where you can adjust the metric, expression, and threshold values that will trigger the alert.
Tips to create custom alerts
Creating custom alerts in your Grafana Snowflake integration can be a powerful way to be ahead of potential issues and performance bottlenecks.
Here are some tips to help you create effective alerts:
- Before setting up alerts, familiarize yourself with the Snowflake metrics available in Grafana. Knowing what each metric represents will help you set meaningful thresholds.
- Identify which/what metrics are critical to your operations. For instance, if you're monitoring query performance, you might prioritize alerts related to query failures or long-running queries.
- Avoid setting arbitrary thresholds... Instead, analyze your historical data to understand typical values and fluctuations. Set thresholds that indicate genuine anomalies rather than normal variations.
- If you set too many alerts or set them too sensitively, you risk overwhelming your team with alerts/notifications, leading to important alerts being ignored. Aim for a balance where you're alerted to genuine issues without being bombarded by false alarms.
- Make sure that alert names clearly describe the issue. Instead of "Threshold Exceeded", use something more descriptive like "Query Duration Exceeds 10 Minutes"
- Alert messages should provide enough context for the recipient to understand the issue. Include information like the specific Snowflake metric details, the current value, and the threshold that was exceeded.
- After setting up an alert, simulate the conditions to trigger it.
- Grafana supports various notification channels, including email, Slack, and more! Depending on the severity of the alert, you might want to use multiple channels to ensure the right people are informed promptly.
- REVIEW + ADJUSTS ALERTS REGULARLY
Pricing/Cost Details of Grafana Snowflake Integration
By connecting your Snowflake instance to Grafana Cloud, you might incur charges. Here's a breakdown of the Pricing/Cost Details of Grafana Cloud:
Grafana Cloud Pricing:
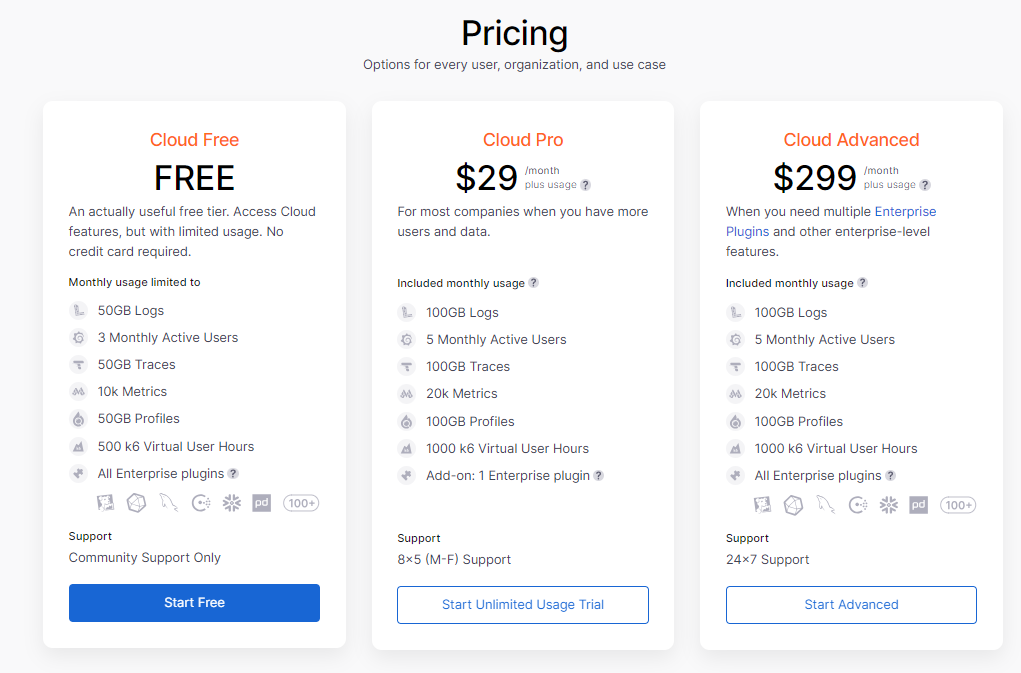
Cloud Free:
- Cost: FREE
- Monthly Usage Limit:
- 50GB Logs
- 3 Monthly Active Users
- 50GB Traces
- 10k Metrics
- 50GB Profiles
- 500 k6 Virtual User Hours
- Support: Community Support Only
Cloud Pro:
- Cost: $29/month (plus usage)
- Included Monthly Usage:
- 100GB Logs
- 5 Monthly Active Users
- 100GB Traces
- 20k Metrics
- 100GB Profiles
- 1000 k6 Virtual User Hours
- Support: 8x5 (M-F) Support
Cloud Advanced:
- Cost: $299/month (plus usage)
- Included Monthly Usage:
- 100GB Logs
- 5 Monthly Active Users
- 100GB Traces
- 20k Metrics
- 100GB Profiles
- 1000 k6 Virtual User Hours
- Support: 24x7 Support
Metrics Costs:
Grafana Cloud Pro provides 1 Data Point per Minute (scrape interval of 60s) resolution at a cost of $8 per 1000 active series of additional usage. If you ship metrics at a DPM of 4 (scrape interval of 15s), your cost will be $8 * 4 = $32 / 1000 active series of additional usage.
Grafana Agent Costs:
Grafana Agent is open-source, meaning it is free to download, install, and use on operating systems like Linux, Windows, macOS, and FreeBSD. You can run the agent on these platforms without paying licensing fees. However, if you integrate it with paid cloud services, infrastructure, premium plugins, or other extras, those additional components may have costs. The core agent itself is free, but extras like premium plugins or cloud hosting come with their own price tags.
Additional Costs—Grafana IRM:
Grafana Incident Response & Management (IRM) is included in Cloud Free for up to 3 active users. Additional users cost $20 per active user per month in Cloud Pro & Advanced plans.
Note: For those who need more than what the these tier offers, Grafana also provides volume discounts and custom pricing options.
Tips and Best Practices (Grafana Snowflake Monitoring)
Monitoring Snowflake using Grafana requires a strategic approach. This ensures you get accurate insights. Here is a list of tips and best practices:
- Ask yourself Why are you monitoring? : Whether it's for performance optimization, cost management, or security, having clear objectives will guide your Snowflake monitoring strategy.
- Choose Relevant Metrics: Focus on metrics that align with your objectives. For instance, if you're concerned about performance, prioritize metrics related to query execution times and warehouse usage.
- Use Descriptive Dashboard Names: Name your dashboards descriptively to quickly identify their purpose. For example, "Snowflake Query Performance" is more informative than "Dashboard 1"
- Set Meaningful Alerts: Set alerts for anomalies that could indicate performance issues, security breaches, or cost overruns. Ensure thresholds are based on historical data to avoid false alerts.
- Regularly Review Dashboards: Periodically review and update your dashboards to ensure they remain relevant as your Snowflake usage evolves.
- Use Annotations: Use Grafana's annotation feature to mark significant events on your graphs, such as software updates or configuration changes, which can help correlate events with metric changes.
- Optimize Data Retention: While it's tempting to store data indefinitely, determine an optimal retention period for your metrics to manage storage costs without compromising on historical insights.
- Secure Your Dashboards: Limit access to your Grafana dashboards to authorized personnel. Use features like role-based access control (RBAC) and two-factor authentication (2FA) for added security.
- Document Your Setup: Maintain documentation on your Grafana-Snowflake setup, including the metrics you're tracking, the reasons for tracking them, and any custom configurations.
- Monitor Cost Metrics: Snowflake's pay-per-use model means that monitoring cost-related metrics is crucial. Set up alerts for unexpected cost spikes.
- Use Grafana's Templating Feature: If you have multiple Snowflake environments (e.g., dev, staging, prod), use Grafana's templating feature to create dynamic dashboards that can monitor multiple environments.
- Regularly Update and Upgrade: Make sure you're using the latest versions of Grafana and Snowflake plugins to benefit from new features, improvements, and security patches.
- Monitor Grafana Itself: Make sure Grafana is performing optimally. Monitor its performance, especially if you have many users or large dashboards.
- Test Alert Configurations: After setting up an alert, simulate the conditions to trigger it. This ensures that the alert works as expected and that notifications are sent to the correct recipients.
- Avoid Overloading Dashboards: While it's essential to have comprehensive monitoring, avoid the temptation to put too many panels on a single dashboard. This can make the dashboard confusing and less actionable.
- Use Descriptions and Tooltips: For complex metrics or those that might not be immediately understandable, use Grafana's description and tooltip features to provide additional context.
Searching for Complete Snowflake Observability? Get It with Chaos Genius
Though Grafana offers powerful visualization and monitoring capabilities for Snowflake, achieving complete observability requires a more holistic approach. Enter Chaos Genius.
Chaos Genius is an advanced Snowflake observability platform designed to supercharge your Snowflake environment. If you integrate Snowflake with Chaos Genius, you unlock a suite of features that not only enhance the performance and management of your Snowflake environment but also provide in-depth insights into your data.
Why Chaos Genius?
Reason 1—Advanced Snowflake Cost Explorer:
Dive deep into your Snowflake costs with detailed analyses. Understand how costs are distributed across services like warehouse compute, Snowpipe, and data storage. Optimize and control your expenditure with precision.
Reason 2—Snowflake Query Recommendations:
Chaos Genius examines millions of queries, identifying top performers and potential bottlenecks. With its enhanced debugging features, you can swiftly pinpoint and rectify performance issues, ensuring optimal query execution.
Reason 3—Snowflake Warehouse Recommendations:
Optimize your Snowflake Warehouse's performance with automated suggestions. From warehouse right-sizing to multi-cluster tuning, Chaos Genius makes sure your warehouse operates at peak efficiency.
Reason 4—Advanced Snowflake Governance:
Maintain a tight grip on your Snowflake account's governance. With insights into user and role activities, you can effectively manage and monitor access, ensuring data integrity and security.
Reason 5—Enhanced Snowflake Alerts:
Stay ahead of potential issues with real-time alerts. Whether it's abnormal spikes in warehouse usage, idle credits, or user activity anomalies, Chaos Genius keeps you informed, allowing for swift remediation.
Conclusion
And that's a wrap! Just like that, you've successfully integrated Grafana and Snowflake. While Snowflake's powerful capabilities are undeniable, tracking its metrics can be a daunting task. Enter Grafana—a visualizing and monitoring tool that brings clarity to the vast metrics universe, including those of Snowflake. With this integration, you're not just accessing data; you're understanding it, visualizing it, and harnessing its true potential. In this article, we covered the step-by-step process of configuring the Grafana-Snowflake integration, explored the intricacies of Snowflake dashboards within Grafana, and delved into creating custom alerts. We also navigated the nuances of pricing, ensuring you get the best value for your investment.
FAQs
What is Grafana?
Grafana is an open-source platform for monitoring and observability, allowing users to query, visualize, and alert on metrics from various data sources.
Is Grafana free to use?
Yes, Grafana is open-source and free to use, but there are also enterprise versions available with additional features.
Which data sources can Grafana integrate with?
Grafana supports various data sources, including Snowflake, Prometheus, Elasticsearch, and Amazon CloudWatch, among others.
Can Grafana send alerts?
Yes, Grafana can send alerts based on specific conditions in your data.
Is Grafana suitable for large-scale deployments?
Yes, Grafana is scalable and can handle large datasets and high query loads.
What is Grafana Cloud?
Grafana Cloud is a fully managed cloud-hosted observability platform provided by Grafana Labs.
How is Grafana Cloud different from Grafana?
Grafana Cloud offers all the features of Grafana plus additional services like managed metrics, logs, and traces, without the need for self-hosting.
What are the costs associated with Grafana Cloud?
Grafana Cloud offers a free plan with certain limits, and there are also paid plans available based on usage.
Does Grafana Cloud support the same data sources as Grafana?
Yes, Grafana Cloud supports a wide range of data sources, similar to the open-source Grafana.
Is Grafana Cloud secure?
Yes, Grafana Cloud provides built-in security features like SSO/SAML/LDAP for user authentication and role-based access control (RBAC).
What is the Grafana Snowflake integration?
The Grafana Snowflake integration allows users to monitor and visualize metrics from their Snowflake account, including credit usage, storage usage, and login success rates.
How does the Grafana Snowflake integration collect metrics?
The integration uses the Grafana Agent to collect metrics for monitoring a Snowflake account.
What are the prerequisites for scraping Snowflake metrics?
To scrape Snowflake metrics, a user configured with the ACCOUNTADMIN role is required, or a custom role that has access to the SNOWFLAKE.ACCOUNT_USAGE schema.
How can one install the Snowflake integration for Grafana Cloud?
In your Grafana Cloud stack, click on "Connections", find Snowflake, and click its tile to open the integration. Review the prerequisites and set up the Grafana Agent to send Snowflake metrics to your Grafana Cloud instance.
What is the snowflake-prometheus-exporter?
The snowflake-prometheus-exporter is embedded in the Grafana Agent and is used for the Snowflake integration.
How often does the integration scrape Snowflake metrics?
By default, the scrape_interval is set to 30 minutes due to Snowflake’s large metric bucket time frames. However, this interval can be adjusted if needed.
What is the Snowflake data source plugin for Grafana?
The Snowflake data source plugin allows users to query and visualize Snowflake data metrics from within Grafana.
What are the requirements for the Snowflake data source plugin?
A Snowflake user with the appropriate role is required. The data source does not require a specific role, but the user's role determines access to tables.
How can one configure the Snowflake data source in Grafana?
Configuring the Snowflake data source requires a Snowflake user with a username and password. It's recommended to create a new user with limited permissions for this data source.
How can one install the Snowflake data source on a local Grafana instance?
For local instances, the grafana-cli tool can be used to install the Snowflake data source.
What are the default dashboards provided by the Snowflake integration?
The Snowflake integration installs dashboards in the Grafana Cloud instance to help monitor the system, including "Snowflake data ownership" and "Snowflake overview".
How can one grant a role to a Snowflake user?
After creating a Snowflake user, the user must be granted a role using the GRANT ROLE command. This role defines the warehouses and tables the user can access.
What is the purpose of the Snowflake data source plugin?
The plugin allows users to query and visualize Snowflake data metrics directly within Grafana.
Is there a way to manually install the Snowflake data source plugin?
Yes, users can manually download the .zip file and unpack it into the Grafana plugins directory.