


Snowflake – thanks to its unique architecture, which separates compute and storage – is a powerful platform. This separation allows for independent scaling and high elasticity, enabling efficient processing of large volumes of data. However, Snowflake’s per-second billing and elastic compute model require frequent monitoring of usage and costs to avoid unexpectedly large bills. To fully leverage Snowflake, it is crucial to implement effective monitoring and alerting practices.
In this article, we will look at 4 critical best practices for streamlining Snowflake monitoring and alerting. So, by following these guidelines, you can make sure that you are well-prepared to handle your Snowflake usage effectively, avoiding any unpleasant shocks in the form of an excessive bill.
Let’s jump right in!
4 Snowflake Monitoring & Alerting Best Practices
1) Use Built-in Tools for Snowflake Monitoring and Alerting
Snowflake provides a range of built-in tools that can simplify the monitoring and alerting process:
a) Snowsight Snowflake Usage Dashboard
Snowflake has improved its UI with a streamlined visualization layer and robust dashboarding capabilities. Snowsight—the Snowflake web interface—is now more intuitive and user-friendly. Snowsight provides a detailed graphical view of Snowflake objects, making it a great way to add Snowflake monitoring capabilities. You can use Snowsight as your preferred Snowflake monitoring tool to create custom dashboards that track credit consumption and usage across different levels. It offers a comprehensive solution for monitoring your Snowflake environment effectively.
Here are the steps to create Snowflake Snowsight dashboard:
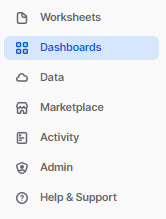
Step 1: Go to Snowsight and click on "Dashboard" in the left-hand side panel.
Step 2: Click on the "+ Dashboard" button at the top right corner.

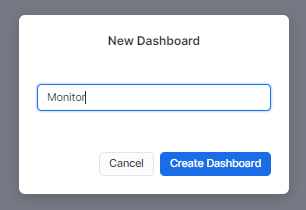
Step 3: Enter the dashboard name and click on "Create a Dashboard".
Step 4: Select the Warehouse to run the dashboard.
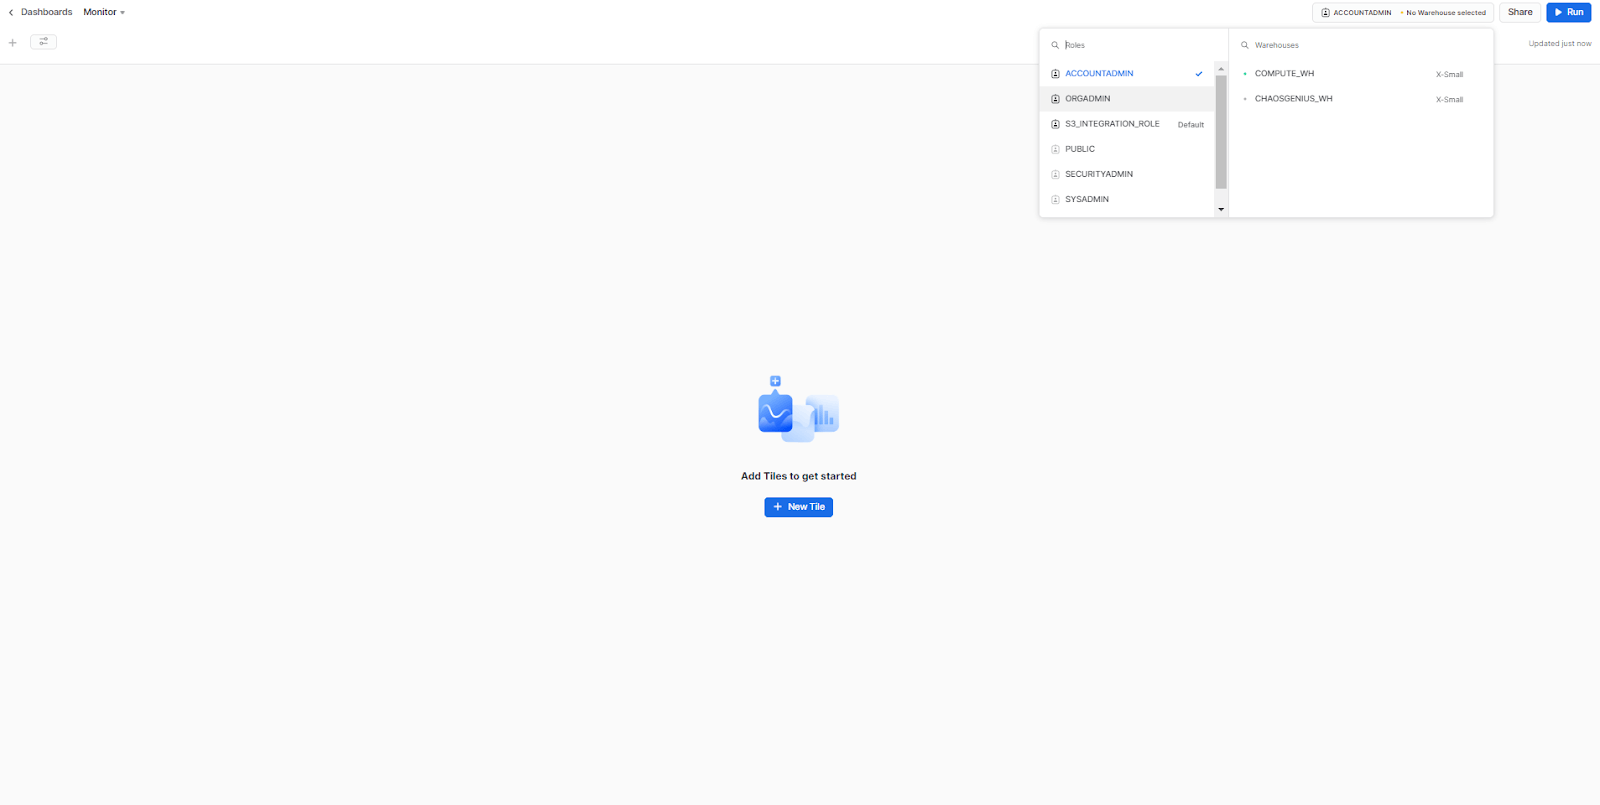
Step 5: Start adding tiles to your dashboard.
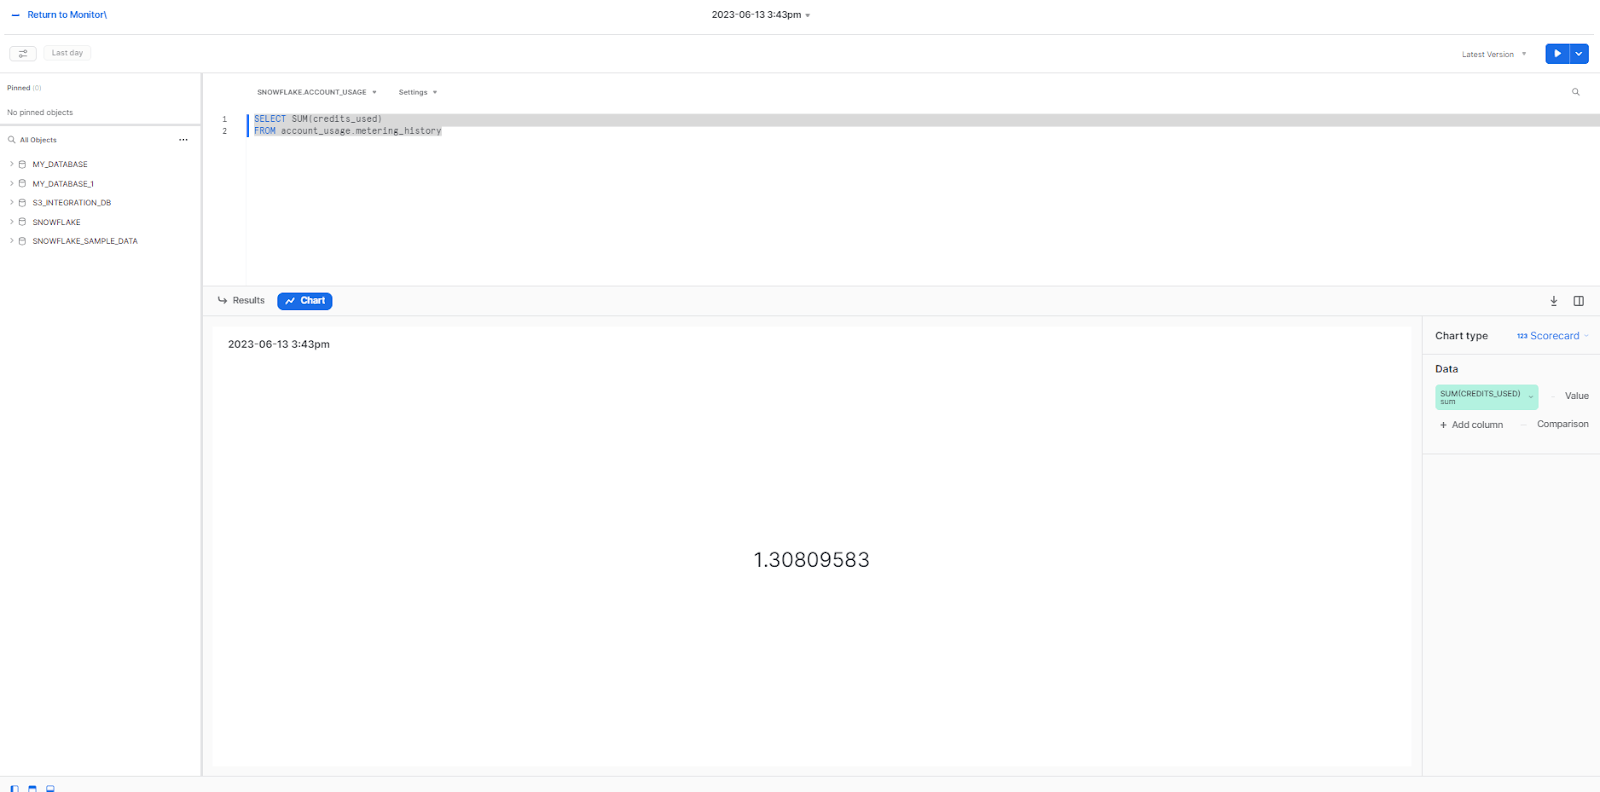
Step 6: Write your query in the designated area.
Here is one sample query:
select
    sum(credits_used)
from
    account_usage.metering_history
Step 7: To display query results as a chart, click on the chart icon and choose the desired chart type.
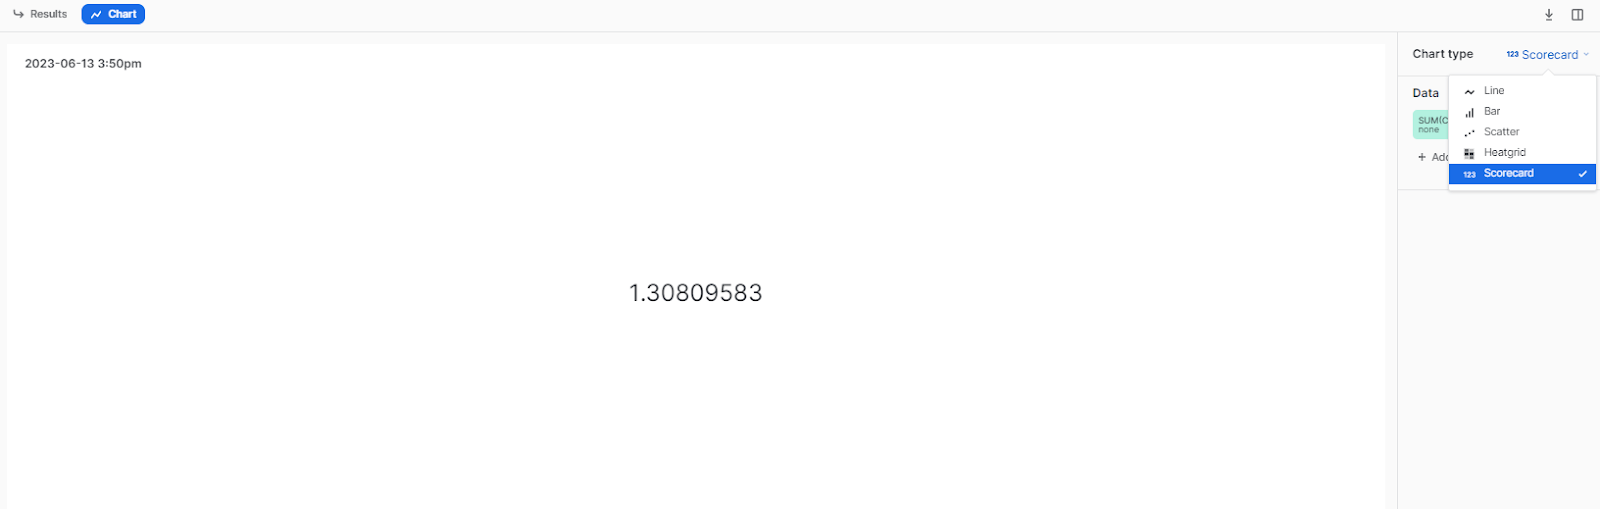
Step 8: Start writing queries and experiment on your own.
b) Snowflake Resource Monitors
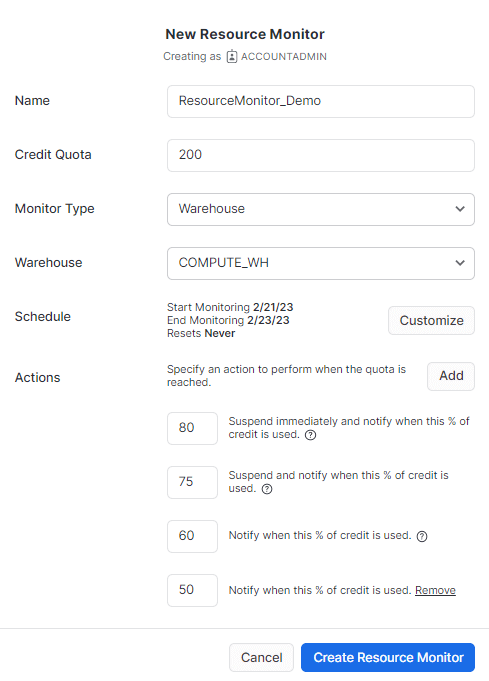
Snowflake Resource Monitors assist in effectively managing and controlling Snowflake costs. It provides the ability to monitor and establish limits on compute resources, enabling you to prevent excessive spending and potential budget overruns. So by carefully configuring Resource Monitors, you can define specific actions to be triggered when usage thresholds are surpassed, such as sending alerts or suspending warehouses. This empowers you with greater control over your Snowflake data warehouse, ensuring that you stay within your budgetary constraints.
Note: Account administrators with the ACCOUNTADMIN role are the only ones who can create resource monitors. However, account administrators can choose to grant other users the ability to create or access resource monitors.
Check out this comprehensive article that delves into the fundamentals of Resource Monitor, covering everything from its definition to step-by-step instructions for setting it up from scratch.
c) Snowflake Query profile
Snowflake Query Profile provides an in-depth report and insight into Snowflake query optimization and query execution. This automated profile is generated after every execution of the query, giving you an array of different metrics and statistics to gain a further understanding of your query’s performance. With the help of these details, users can easily evaluate their query to understand execution time better and pinpoint key areas for Snowflake query optimization.
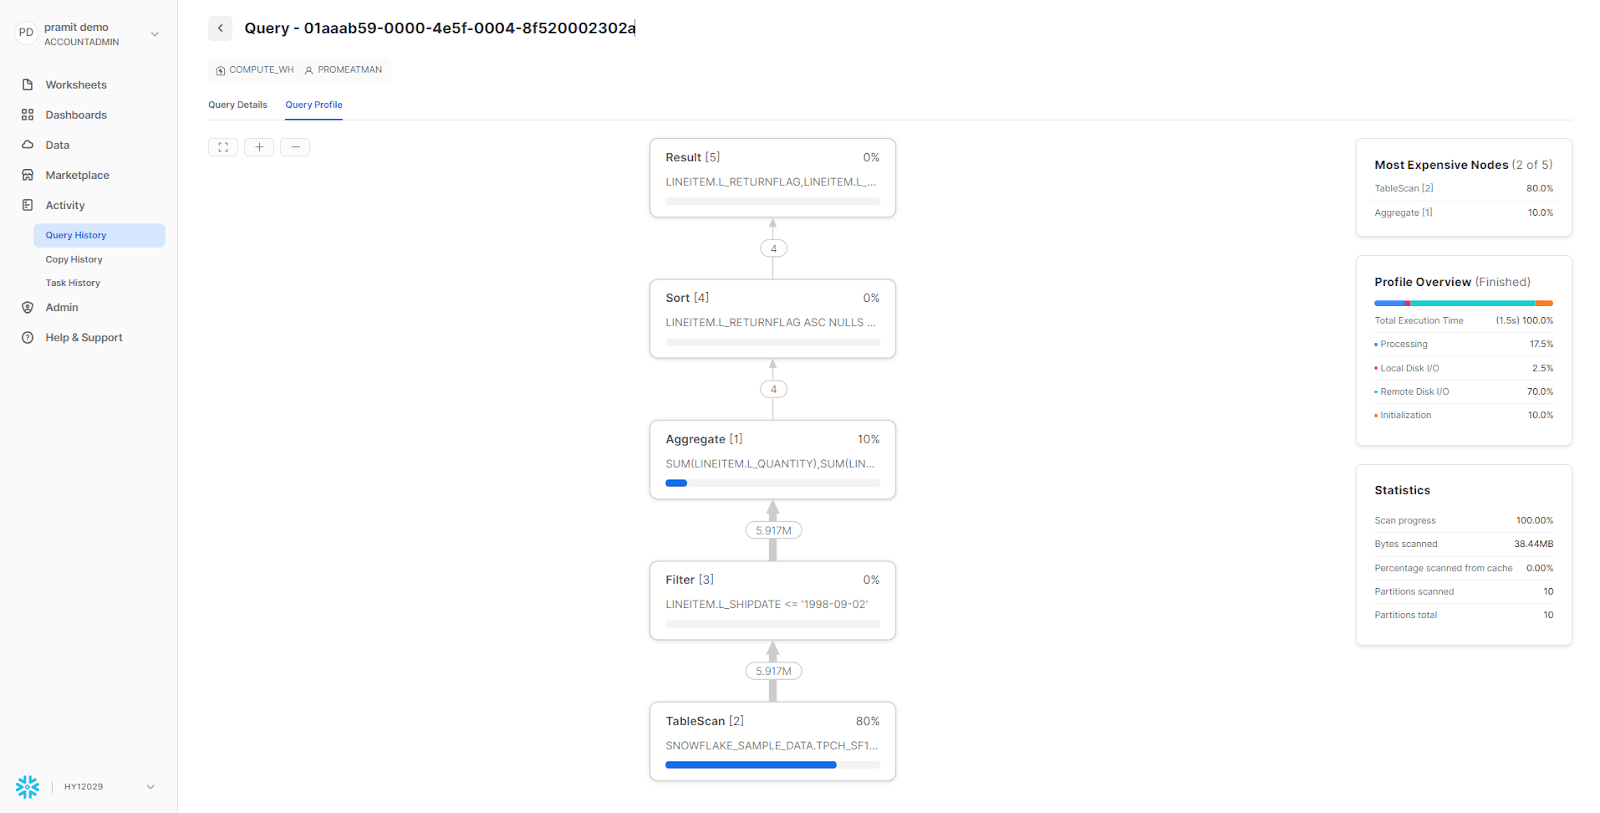
Check out this article to learn more about the Snowflake query profile. It covers the essentials, including a detailed definition and step-by-step instructions for setting up the query profile from scratch.
d) ACCOUNT_USAGE view
ACCOUNT_USAGE schema is also a valuable Snowflake monitoring tool that enables users to query object metadata, as well as historical usage data, for their account. This schema enables users to actively monitor various aspects of their environment, and access daily usage metrics to make data-driven decisions.
The following are some of the views that the ACCOUNT_USAGE schema provides which can be used to monitor Snowflake usage:
- QUERY_HISTORY: This view provides information about the history of queries that have been run in the account. The view includes information about the query text, the time it took to run, the number of rows processed, and the amount of data transferred. It can be used to monitor Snowflake query performance and identify queries that are taking a long time to run or that are using a lot of resources. The view can also be used to track changes in Snowflake query performance over time.
- WAREHOUSE_METERING_HISTORY: This view can be used to return the hourly credit usage for a single warehouse (or all the warehouses in your account) within the last 1 year.
- DATABASE_STORAGE_USAGE_HISTORY: This view provides information about the average daily storage usage, in bytes, for databases in the account for the last 365 days (1 year). The data includes all data stored in tables in the database(s), as well as all historical data maintained in Fail-safe for the database(s).
- DATA_TRANSFER_HISTORY : This view can be used to query the history of data transferred from Snowflake tables into a different cloud storage network and/or geographical region within the last 1 year. The view includes the history for your entire Snowflake account. This information can be used to identify areas where data transfer costs can be reduced.
Check out the comprehensive list of views available within the ACCOUNT_USAGE schema.
2) Implement a Comprehensive third-party Snowflake Observability Solution
While Snowflake provides built-in tools for monitoring usage, they may lack the specific details that you actually require. To effectively manage Snowflake usage, leveraging third-party Snowflake observability tools becomes necessary. There are numerous tools in the market that can help monitor and create alerts for Snowflake usage. Here are a few popular ones that can greatly assist you:
Now, when it comes to choosing a reliable third-party tool for Snowflake observability, monitoring and usage, Chaos Genius stands out as the best choice. It offers a wide range of features surpassing other Snowflake tools available. Here are the exceptional features offered by Chaos Genius:
- Advanced Snowflake Cost Explorer: Get detailed analysis and control over cost and credit usage across all Snowflake services, including warehouse compute, Snowpipe, search optimization, auto-cluster, data storage, and data transfer. Analyze cost breakdowns, identify cost drivers, and optimize resource allocation.

- Query Recommendations: Optimize Snowflake query performance and streamline debugging processes with comprehensive recommendations. Analyze workload patterns, identify top queries based on costs, run-time, queue times, and partitions scanned. Debug queries with a comprehensive view and visualize query workload evolution with charts and histograms.
- Warehouse Recommendations: Monitor and optimize the performance of your Snowflake Warehouse with automated recommendations. Achieve warehouse right-sizing, multi-cluster tuning, and cross-warehouse optimizations for improved performance.
- Advanced Snowflake Governance: Obtain extensive visibility into Snowflake account usage across different roles and users. Gain insights into user growth, usage patterns, and effectively manage user and role management.
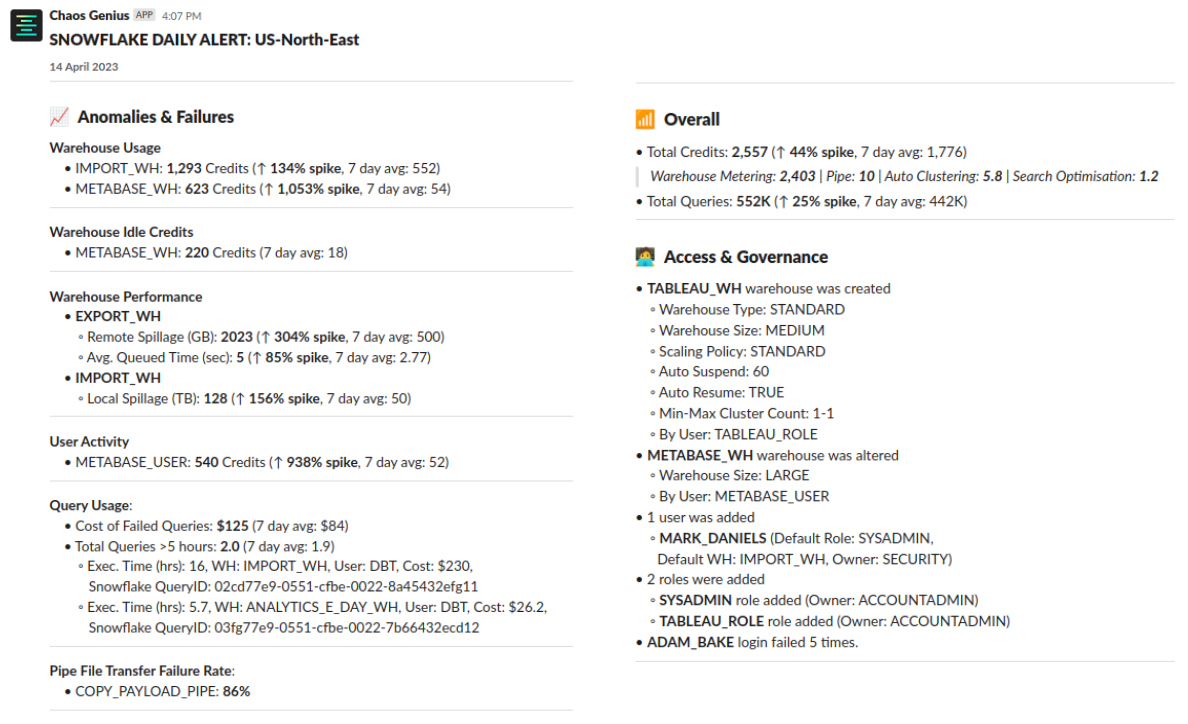
- Snowflake Alerts: Stay updated on Snowflake consumption with vital Snowflake alerts. Receive notifications about anomalies, failures, warehouse usage, user activity, query usage, pipe file transfer failure rate, total credits utilized, total queries executed, access and governance alerts—and more, directly into your email or via Slack.
Save up to 30% on your Snowflake spend in a few minutes!


3) Set Up Effective Snowflake Alerts Mechanisms for Key Metrics and Establish a Response Plan
One of the most important benefits of setting up effective alerting mechanisms is that it can help you to identify and respond to critical events and anomalies in a timely manner. This can help to prevent data loss, downtime, and various other problems. Snowflake Alerts can be set up to trigger based on a variety of criteria, such as Snowflake resource utilization, Snowflake query performance metrics, and various error conditions, allowing you to be alerted to potential problems before they cause any significant disruptions.
Here are some steps you can take to set up effective Snowflake alerting mechanisms:
- Identify the critical events and anomalies that you want to be alerted to. What are the things that could go wrong that would have a significant impact on your Snowflake usage?
- Define the thresholds or conditions that will trigger an alert. How much resource utilization, performance degradation, or error rate is too much?
- Choose the right alerting mechanism. There are a variety of ways to send alerts, such as email, Slack, or webhooks. Choose the method that will work best for you.
- Test your Snowflake alerts. Make sure that your Snowflake alerts are working properly by sending test notifications.
- Review your Snowflake alerts constantly and on a regular basis. As your requirements change, you may need to update your alerting thresholds or conditions.
In addition to configuring Snowflake alerts, you also need to establish a structured response plan for them. This plan should outline the steps that you will take to resolve any issues that are triggered by an alert.
The response plan should include the following:
- The person or team responsible for resolving the issue
- The steps that need to be taken to resolve the issue
- The expected outcome of the resolution
Finally, you need to define the roles and responsibilities for incident response. This will ensure that everyone knows who is responsible for what in the event of an issue.
Once you have identified and resolved an issue, you need to implement a remediation strategy to prevent it from happening again. This may involve making changes to your environment, processes, or policies.
4) Use BI Tools
BI tools are a great way to monitor Snowflake performance and usage. They provide a centralized view of all your data, which makes it easy to identify trends and patterns.
BI dashboards can be used to monitor critical Snowflake usage metrics, such as query duration, query success rate, data load times—and ofcourse credit costs/usage. These dashboards provide real-time insights into the performance of the Snowflake data warehouse, enabling users to quickly identify any issues that may impact Snowflake performance.
Some popular BI tools that can be used for monitoring Snowflake usage include:
— and a whole lot more!
While using BI tools/dashboard is the best practice for monitoring and alerting in Snowflake, it is important to note that these tools do not offer great monitoring capability. They are good first steps to get on top of your Snowflake usage and performance, but they should not be your only monitoring solution. You should also use Snowflake's built-in tools and third party Snowflake monitoring tools like Chaos Genius to monitor and set alerts to ensure that you are notified of any potential problems.
Want to take Chaos Genius for a spin?
It takes less than 5 minutes.

Conclusion
Implementing these essential Snowflake monitoring and alerting best practices is crucial for optimizing your data platform. In this article, we discussed 4, key practices to ensure effective Snowflake monitoring and alerting. Here's a quick summary of what we covered:
- Utilize built-in tools for Snowflake monitoring and alerting.
- Implement a comprehensive third-party Snowflake monitoring solution.
- Set up effective Snowflake alert mechanisms.
- Conduct regular reviews of your Snowflake monitoring data.
- Harness the power of BI tools.
- Set up Snowflake alerts for key metrics and establish a response plan.
So by following these best practices, you can ensure that your Snowflake environment is robust, efficient, and continuously improving. Just like a well-tuned engine in a car, these practices keep your Snowflake running smoothly and efficiently, ensuring optimal performance at all times.
FAQs
What are some of the most important metrics for Snowflake monitoring?
Some of the most important metrics for Snowflake monitoring include:
- Snowflake Query performance
- Data usage
- Storage usage
- Warehouse usage
- Cost
- Security
What built-in tools does Snowflake provide for Snowflake monitoring and alerting?
Snowflake provides several built-in tools, including Snowsight (Snowflake Usage Dashboard), Snowflake Resource Monitors, and Snowflake Query Profile.
Can Snowflake Query Profile assist in query optimization?
Yes. Snowflake Query Profile provides detailed reports on Snowflake query performance, aiding in query optimization and execution. It offers metrics and statistics to evaluate and improve query efficiency.
What is Snowflake Account_usage?
The Snowflake ACCOUNT_USAGE schemas allows querying object metadata and historical usage data, associated with your account.
What is account usage Warehouse_metering_history?
Warehouse_metering_history is a Snowflake view that can be used to return the hourly credit usage for a single warehouse (or all the warehouses in your account) within the last 365 days (1 year).
How can I create a Snowflake Snowsight dashboard?
To create a Snowsight dashboard, follow these steps:
- Go to Snowsight and click the "Dashboard" section.
- Click "+ Dashboard" at the top right, and then enter the dashboard name.
- Select the warehouse to use for the dashboard.
- Add tiles to your dashboard, and then write your query in the designated area.
- Choose the desired chart type to display query results as a chart.
Should I set up effective Snowflake alerting mechanisms?
Yes. Effective alerting mechanisms are crucial for identifying critical events and anomalies promptly. Alerts can be triggered based on resource utilization, Snowflake query performance metrics, and error conditions, enabling quick detection and response to potential issues.
How do you monitor a warehouse in a Snowflake?
Key ways to monitor Snowflake warehouses are using the account usage views to analyze historical load, examining the load monitoring charts in Snowsight, and setting alerts for nearing credit limits.
What is resource monitoring in Snowflake?
Resource monitoring in Snowflake allows tracking virtual warehouse credit usage and controlling costs by setting credit limits to suspend warehouses. This helps optimize spending on compute resources.
Are there any third-party tools recommended for Snowflake observability?
Yes, some popular third-party tools for Snowflake observability include Chaos Genius, Holistics, Monte Carlo, Datadog - Snowflake Integration, and PowerBI. Chaos Genius is powerful and packed with advanced features for Snowflake cost analysis, query recommendations, warehouse optimization, governance and alerts.
Is Snowflake a data management tool?
Yes, Snowflake provides an integrated cloud platform for various data management needs - storage, governance, lineage, optimization, security, and analytics.
Is Snowflake a SaaS or Paas?
Snowflake is a SaaS as it is a fully managed cloud data platform provided as a service requiring no infrastructure setup or maintenance.
Is Snowflake a data warehouse or ETL?
Snowflake is both a powerful cloud data warehouse and supports ETL workflows either through native functionality or integrations with ETL tools.