


Anomaly detection is a process that finds and flags patterns in data that do not conform to the expected behaviour [3]. Anomaly detection use cases are spread across finance, health care, cyber-security, and more. Businesses can also use anomaly detection to better understand changes in their data and find these changes in real-time. Anomalies in the data can translate to actionable information [3]. As an example, anomalies in payment failures could tell us that our payment portal is not functioning properly. Similarly, anomalous network activity could tell us of a hacked computer or compromised server infrastructure.
History of Anomaly Detection - Background & Applications
Foundation
In the 1980s, anomaly detection found its foundation as a means of keeping intruders out; Dorothy E. Denning worked on intrusion detection which would become the foundation for many anomaly detection techniques and applications to come.

Denning was an early pioneer in the field of computer security; As she pursued a degree at Purdue University at Indiana, there were very few classes, books, or conferences focused on security. In fact, after her PhD, Denning ended up teaching one of the first computer security courses in the country [8]. She focused much of her work on the protection of sensitive information as it is processed by software. Denning notes an example about tax returns, “I think one of the examples cited is when you send your tax return to a tax preparation software or service for processing. They should be able to process your return without having sensitive information get into the hands of people that shouldn’t have it [8].” Her interest in this field led her to work on intrusion detection for the Navy at Stanford Research Institute International in ‘83. This work built up to her revolutionary work, An Intrusion-Detection Model [8]. The work proposed a model that detected a broad range of intrusions including not only attempted intrusion by outsiders but also system abuses by insiders [5].
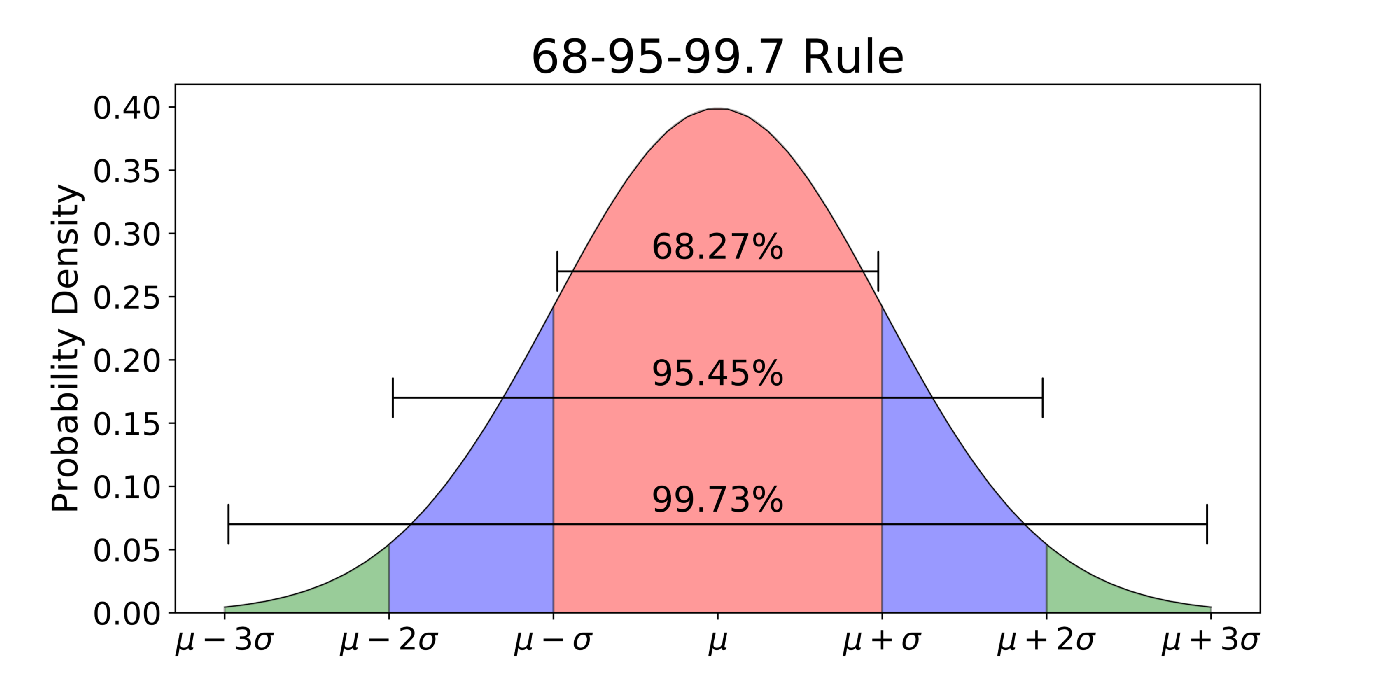
While Denning’s work was the first real application in the history of anomaly detection, some early anomaly detection techniques in the manufacturing industry in the 1930s were the precursor to it. One such process mentioned in `Economic Control of Quality of Manufactured Product` would classify gaussian distribution data values that are 3 standard deviations σ above or below the expected value µ as an anomaly. The interval µ ± 3σ covers approximately 99.7% of the data. The probability, then, that a random variable falls outside this region, and is labelled as an anomaly, is 0.3%. This is akin to the simplest anomaly detection-like technique still used in rudimentary systems.
Fraud Detection
In 1999, scientists from Bell Atlantic Science and Technology (now Verizon Communications) proposed a generalized activity monitoring framework as the basis for fraud detection [6]. Typically, anomaly detection techniques are trained based on the usage of an individual and monitored for discrepancies.
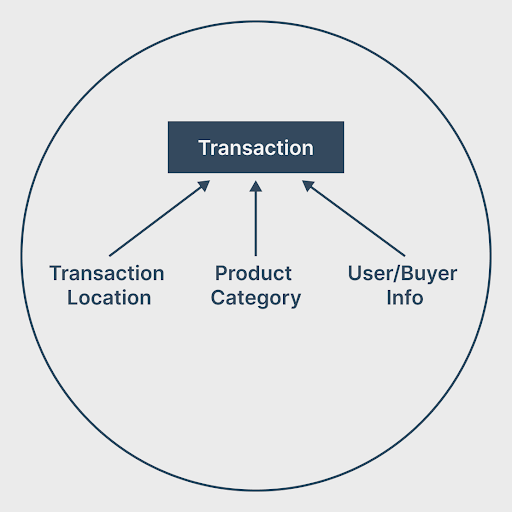
For catching credit card fraud, data could be collected for various relevant dimensions, including transaction location, transaction amount, product bought, product category, and more.
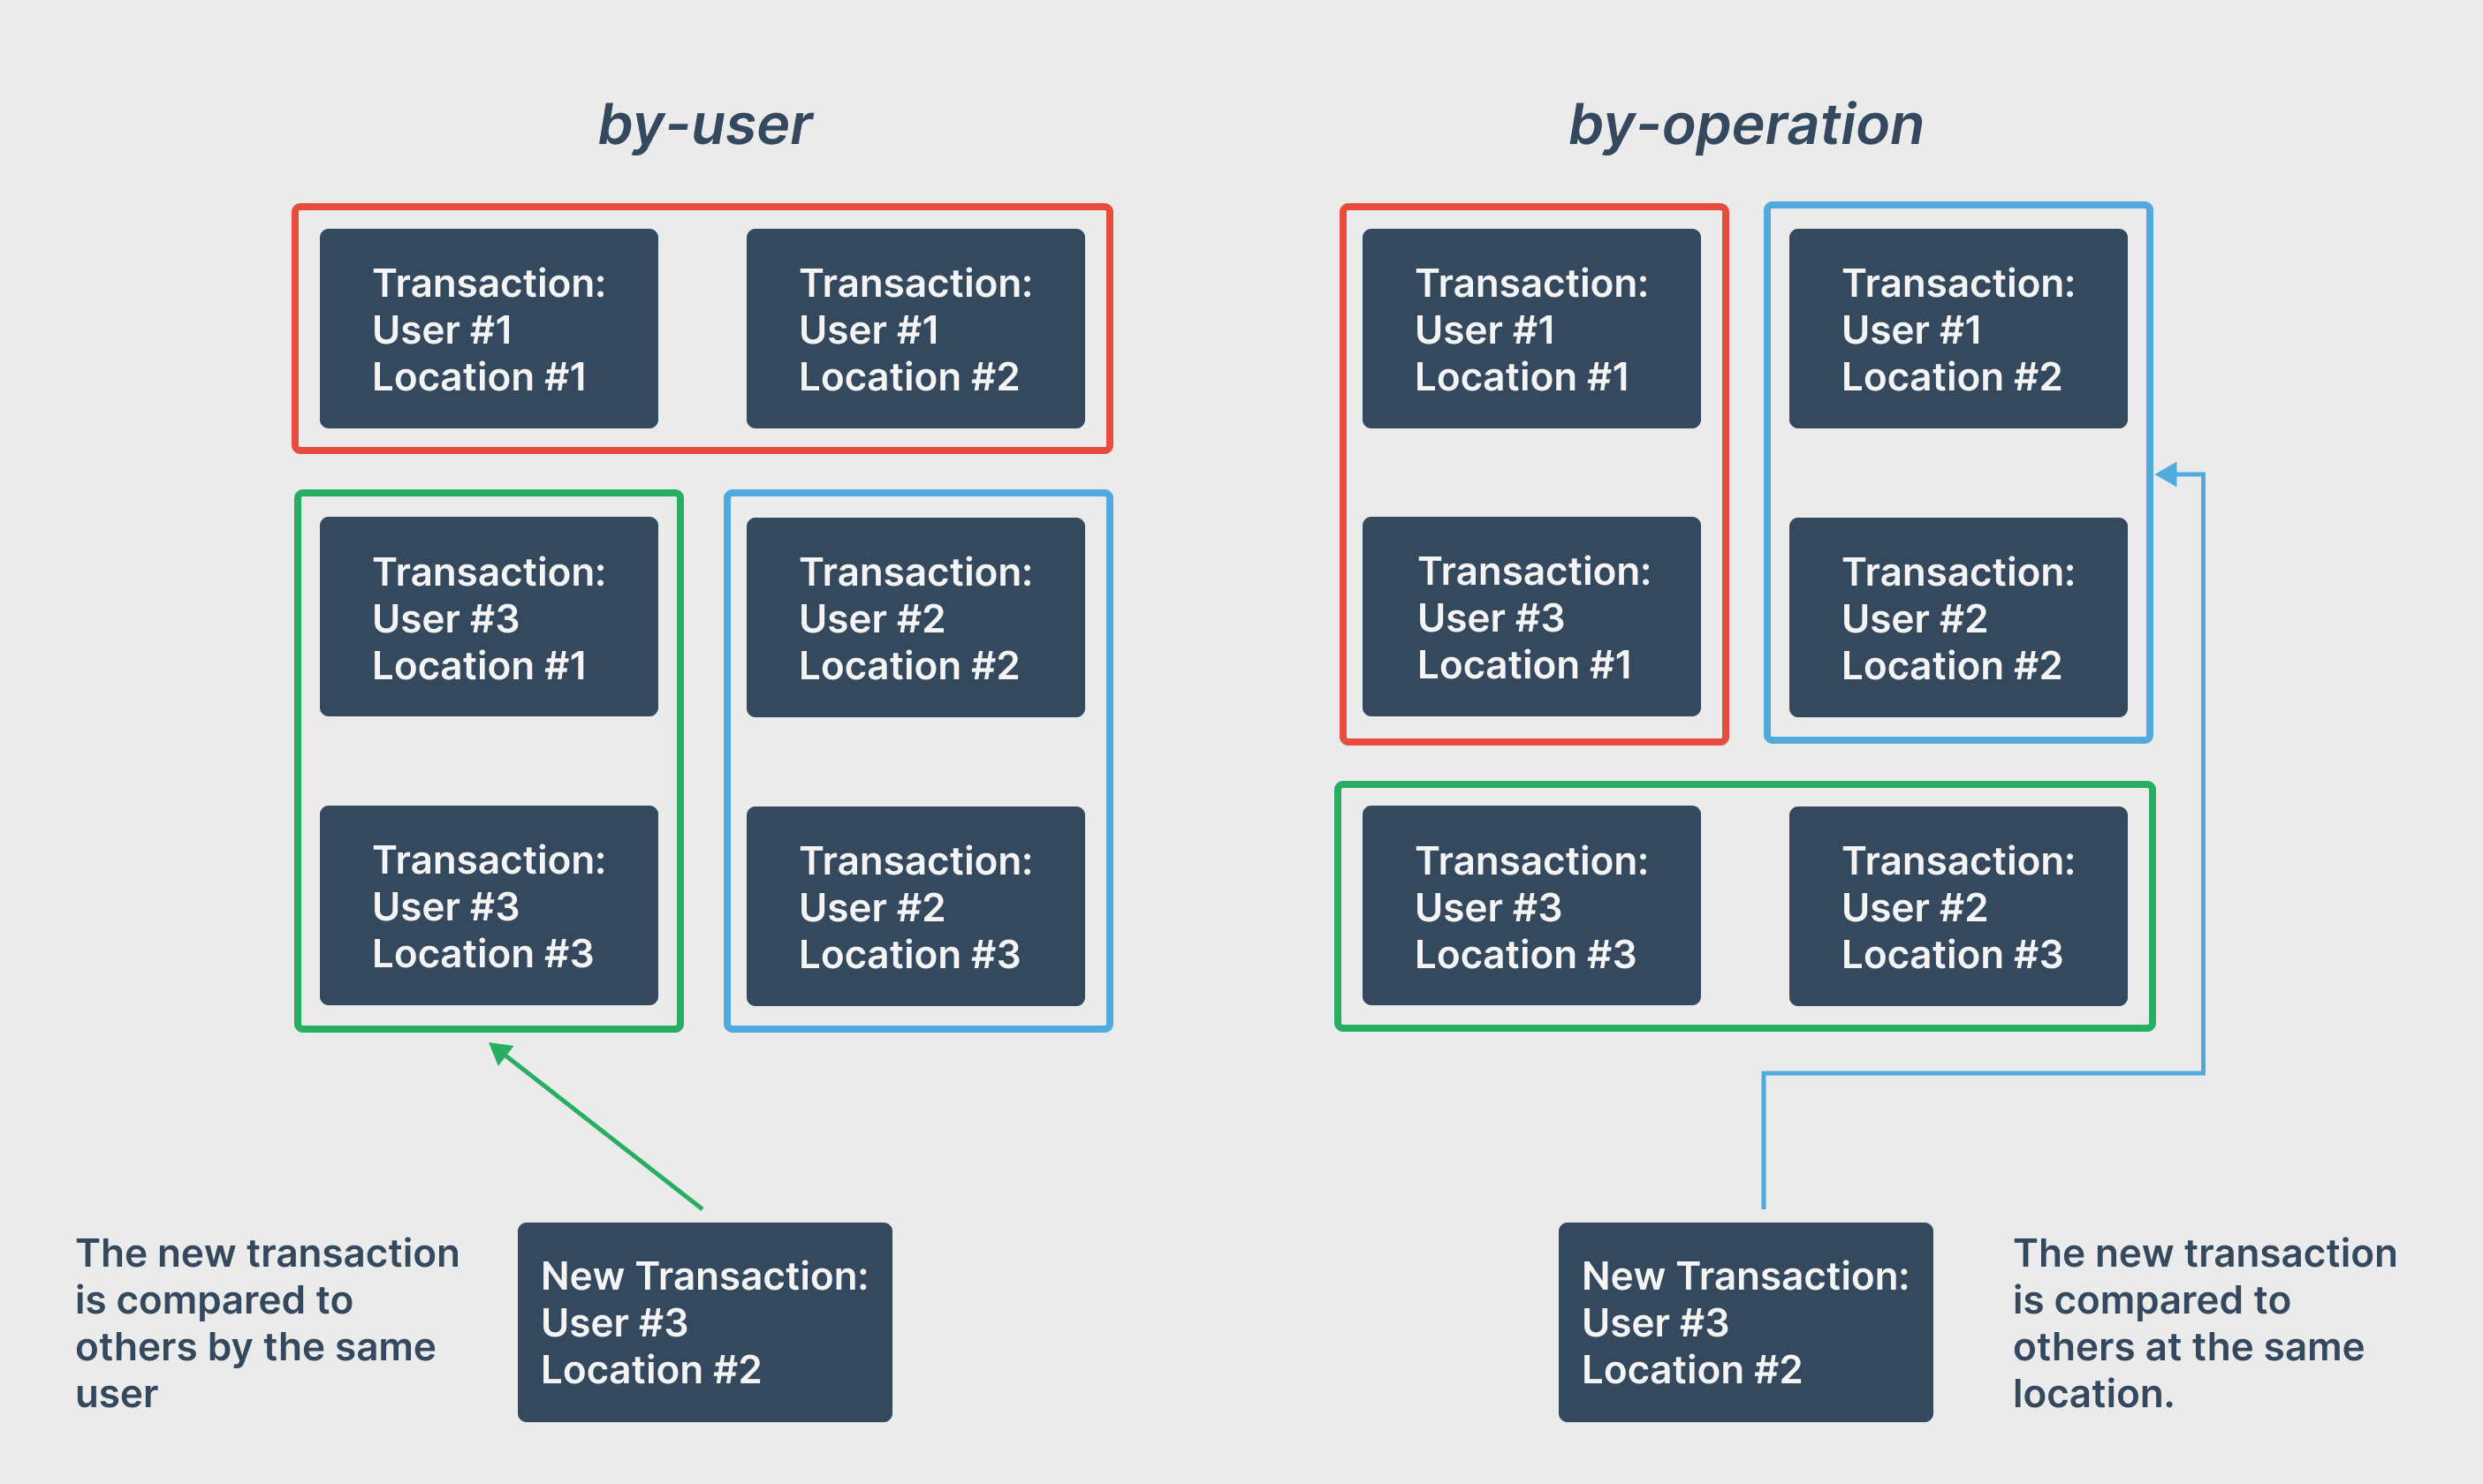
In this field, there are two popular anomaly detection techniques. The by-user technique monitors each credit card used by their specific usage patterns over time [3]. When a user makes a transaction, it is compared to previous transactions by this user and labelled anomalous accordingly. In comparison, the by-operation technique monitors transactions at a specific location and compares new transactions to previous ones at that same location [3].
Similarly, in the insurance claim domain, manually investigated cases can be used in a supervised approach for fraudulent insurance claims detection. And in the stock trading domain, anomaly detection techniques can be applied to quickly root out people using insider information to make profits.
Medical and Public Health Anomaly Detection
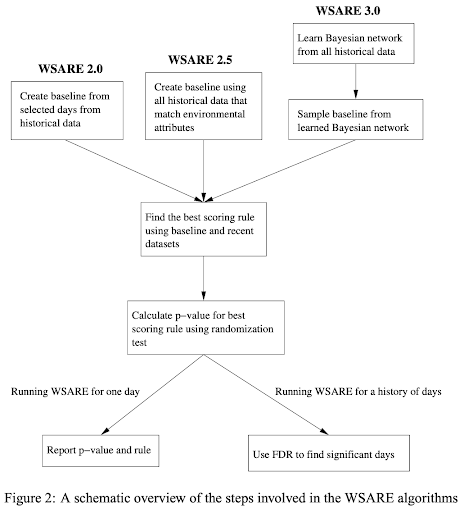
In addition to the vast number of anomaly detection use cases in fraud detection, anomaly detection techniques have been found useful for medicine and public health. In 2002, researchers at Oregon State & Carnegie Mellon University proposed algorithms to apply anomaly detection to the early detection of disease outbreaks. The paper proposes a What’s Strange About Recent Events (WSARE) algorithm which compares recent healthcare data to a baseline dataset [12]. Due to this algorithm’s multivariate approach, it can catch anomalies in specific subgroups of the population.
Besides this, patient records can be analyzed to identify potential instrument or recording errors and point out anomalous patient conditions. This data may have numerous dimensions including age, blood type, weight, and data could be temporal or spatial. Anomaly detection has also been used to monitor Electrocardiogram (ECG) and Electroencephalogram (EEG) readings.
Industrial Damage Detection
Furthermore, in 2007 The Boeing Company presented methods to apply anomaly detection to sensor data. To find outliers with highly frequent sensor data, an efficient technique is needed. They proposed 2 methods that compare a given point to the median of neighbouring points, to determine outlier status [1]. This opens anomaly detection to applications in monitoring industrial damage of mechanical components and in physical structures. Temporal Data from sensors can be analyzed to detect anomalies in the performance of mechanical components such as motors. Similarly, temporal data can be collected and analyzed which can expose structural defects such as cracks in beams.
Modern Applications - Fraud Detection in Uber, Netflix, LinkedIn & Pinterest
To make informed decisions, Uber needs to ensure data quality amongst the data collected from the millions of Uber rides every day. Manually scrubbing through data is unfeasible with the massive amounts of data collected every day.
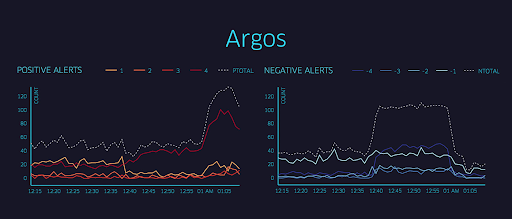
Uber developed Argos for Uber’s fraud detection i.e. provide accurate, real-time alerts on relevant business metrics. Initially, Uber employed static threshold values along with an alerting system to notify on-call engineers. However, given Uber’s rapid growth, thresholds needed to be updated regularly, and the demand for a dynamic system grew. They found that static thresholds encountered two problems. False negatives resulted in undetected issues. And false positives result in hundreds of daily false alarms creating alert fatigue if and when real outages occur [2].
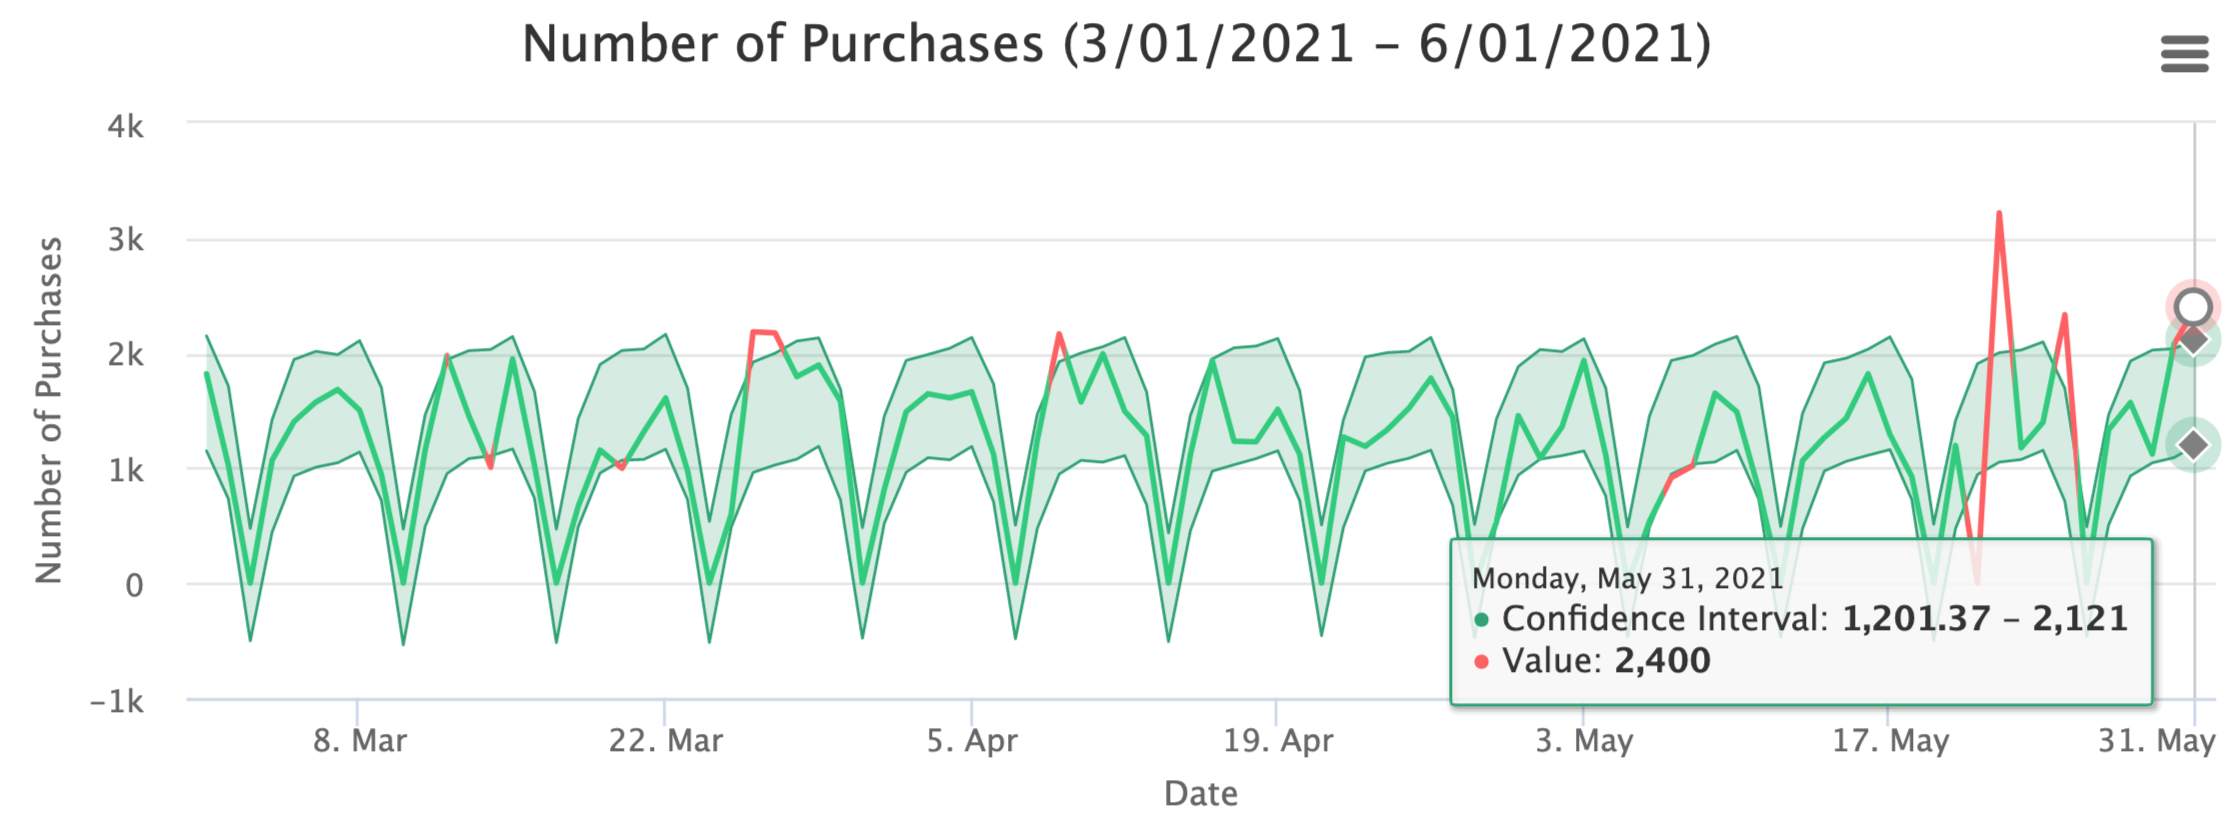
To help automate their data quality analysis, Uber developed an anomaly detection framework, Data Quality Monitor (DQM). Uber’s DQM looks for places where high-level changes occur, comparing the current data to what’s expected based on past observations [8]. For example, if the number of rows or data entries sees a drop large enough to be considered statistically significant, this could be flagged as a data quality issue.
If a data quality issue is found to occur, Uber also wants to narrow their scope and try to identify where the data quality issue occurred. It is important to know what caused the issue so that the data pipeline can be fixed if needed. Uber employs a multi-dimensional breakdown to help find which dimensions have anomalies that contribute to the data quality issue [8].
Similarly, many companies have adapted anomaly detection into their data analytics workflow. Netflix, for instance, has developed their own anomaly detection implementation which they’ve used to detect anomalies in their payment network which may be a failure at the bank level. Netflix also applies this to their customer sign-up process; Anomalies for unique browser/laptop configurations help Netflix engineers solve sign-up problems quickly [11].
Additionally, LinkedIn has its own anomaly detection software named ThirdEye. ThirdEye has found various anomaly detection use cases at LinkedIn including monitoring site performance and user adoption of new features [10]. Similarly, at Pinterest, an anomaly detection architecture is used to set up an internal dashboard, Statsboard, which allows them to visualize metrics with elaborate patterns and react to incidents as they happen [4].
The team at Chaos Genius applied anomaly detection techniques & root cause analysis at a scale previously at Fortune 500 companies. Now they are trying to democratize anomaly detection at scale by making it accessible and easy to use. Check out and access our Github Repository here.
References
[1] Basu, S. and Meckesheimer, M. (2007) Automatic outlier detection for time series: an application to sensor data.
[2] Bell, F. (Nov. 24, 2015) Identifying Outages with Argos, Uber Engineering’s Real-Time Monitoring and Root-Cause Exploration Tool. https://eng.uber.com/argos-real-time-alerts/
[3] Chandola, V., Banerjee, A. and Kumar, V. (2007) Anomaly Detection: A Survey.
[4] Chen, K. and Overstreet, B. (Jul 30, 2019) Building a real-time anomaly detection system for time series at Pinterest. https://medium.com/pinterest-engineering/building-a-real-time-anomaly-detection-system-for-time-series-at-pinterest-a833e6856ddd
[5] Denning, D. (Feb. 1987) An Intrusion-Detection Model.
[6] Fawcett T. and Provost F. (1999) Activity Monitoring: Noticing interesting changes in behavior.
[7] Galarnyk, M. (Jun. 3, 2018) Explaining the 68-95-99.7 rule for a Normal Distribution. https://towardsdatascience.com/understanding-the-68-95-99-7-rule-for-a-normal-distribution-b7b7cbf760c2
[8] Grimes, R. (May 2017) Hacking the Hacker. https://www.oreilly.com/library/view/hacking-the-hacker/9781119396215/
[9] Li, Y.-H., Agrawal,l R., Shanmugam, S. and Pasqua, A. (May 7, 2020) Monitoring Data Quality at Scale with Statistical Modeling. https://eng.uber.com/monitoring-data-quality-at-scale/
[10] Pucher, A. (Jan. 9, 2019) Introducing ThirdEye: LinkedIn’s Business-Wide Monitoring Platform. https://engineering.linkedin.com/blog/2019/01/introducing-thirdeye--linkedins-business-wide-monitoring-platfor
[11] Wong, J., Colburn, C., Meeks, E. and Vedaraman, S. (Feb. 19, 2015) RAD — Outlier Detection on Big Data. https://netflixtechblog.com/rad-outlier-detection-on-big-data-d6b0494371cc
[12] Wong, W.-K., Moore, A., Cooper, G. and Wagner M. (2002) What’s Strange About Recent Events (WSARE): An Algorithm for the Early Detection of Disease Outbreaks.