


Introduction
With the advent of cloud-based applications, it became imperative for organizations to continuously monitor the performance of their application and services to their customers. Monitoring has traditionally been confined to infrastructure and application metrics. It has evolved from monitoring application error logs to sophisticated infrastructure metrics observability. While DevOps teams have a plethora of such observability tools (such as DataDog, Splunk, NewRelic) at their disposal, the rest of the teams within the organizations (namely data teams, business & operations teams) have lagged in the toolkits they use - excel sheets and static BI dashboards. This has led to a lop-sided development in the observability space, where all monitoring is heavily focused on IT systems & infrastructure performance without the business context.
However, there is an increased awareness and need for Full Stack Observability. There has been rapid development in the Data Observability space in the last few years, especially targeting the Data Engineering teams. The next few years will see the rise of Business Observability tools for Data & Business Teams, making traditional BI dashboards & excel-based analysis feel like a relic of the past. Let's first dive into the fundamentals of Observability and learn how different parts of the organization are moving to Observability.
Observability vs. Monitoring
First things first, the perennial question of what separates Monitoring from Observability. DevOps Research & Assessment (DORA) -part of Alphabet Inc., as a part of their research, defined these terms as follows:
Monitoring is tooling or a technical solution that allows teams to watch and understand the state of their systems. Monitoring is done by gathering predefined sets of metrics or logs.
Observability is tooling or a technical solution that allows teams to debug their system actively. Observability is exploring properties and patterns not defined in advance.[1]
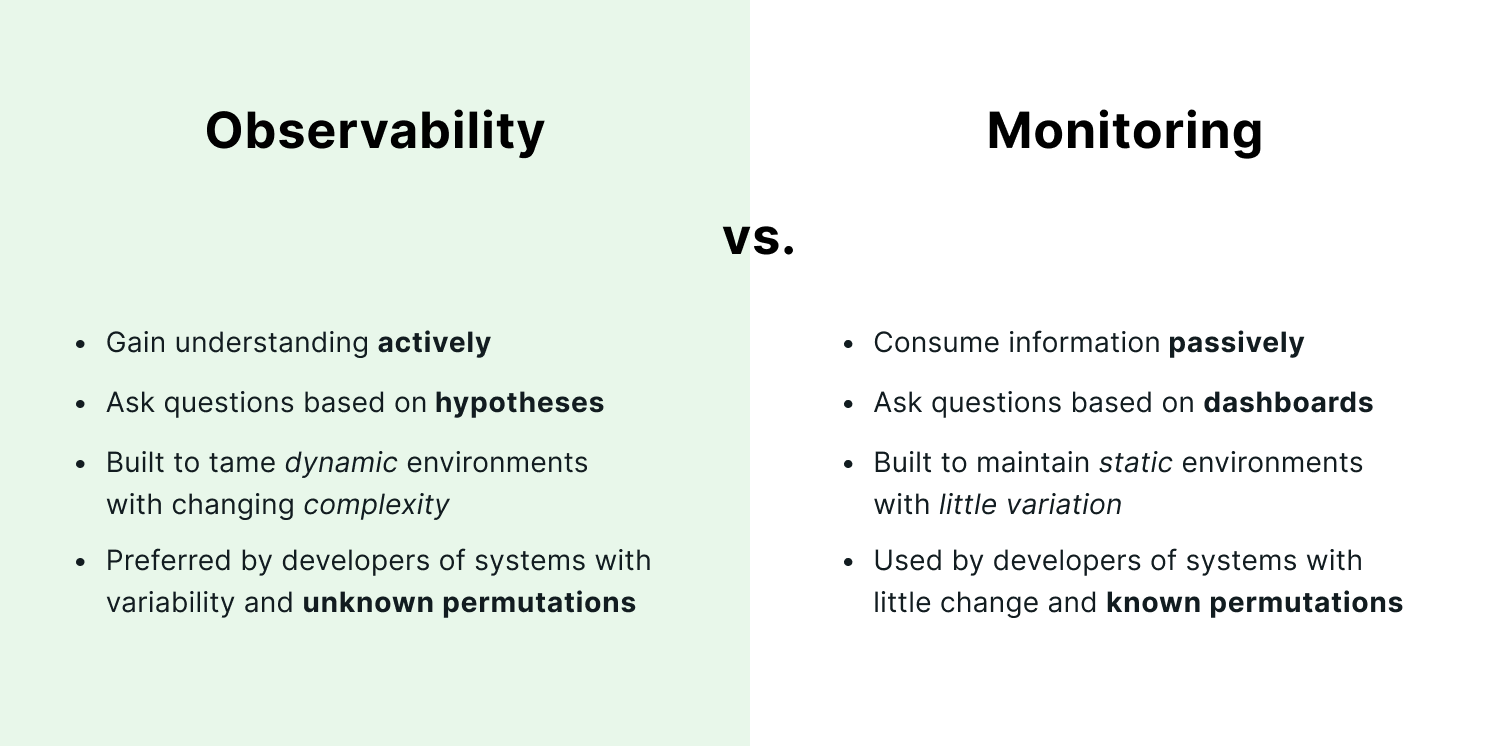
Monitoring focuses on a set of predefined system health metrics and how they change with time. Logging provides separate data but is viewed in isolation generally. Monitoring helps one understand "WHAT" is changing. This is helpful when the points of failure of a system are well understood, and there are fewer unknowns.
Observability is the ability to understand a system's internal state by analyzing the data it generates, such as logs, metrics, and traces. Observability takes monitoring to the next level, by not only highlighting "WHAT" is changing, but analyzing the related data sets to answer "WHY" did some metrics change and identify the root cause. Observability becomes especially important in distributed systems, where there could be many failures, and it's impossible to foresee the point of failures in advance.
The below infographic from Lightstep summarizes the difference aptly.
From APM to System's Observability
Application Performance Monitoring (APM) has slowly evolved into system's observability over the years. System's observability is to observe infrastructure and systems performance via the traditional '3 pillars of observability' - Logs, Metrics & Traces [2].
Logs: Logs entries consist of structured and unstructured data emitted by an application in response to some event in the code. Logs are complementary to metrics as they provide the context of events in the application when the metrics are captured.
Metrics: Metrics, quite simply, are a set of measurements generally captured over time to indicate the system's health. The most common infrastructure metrics are Latency, Query time, Traffic, Errors, Utilization, etc.
Traces: A single trace shows an individual transaction or request activity as it flows through an application. It's most relevant to observability and to diagnose the root cause of change in any metrics.
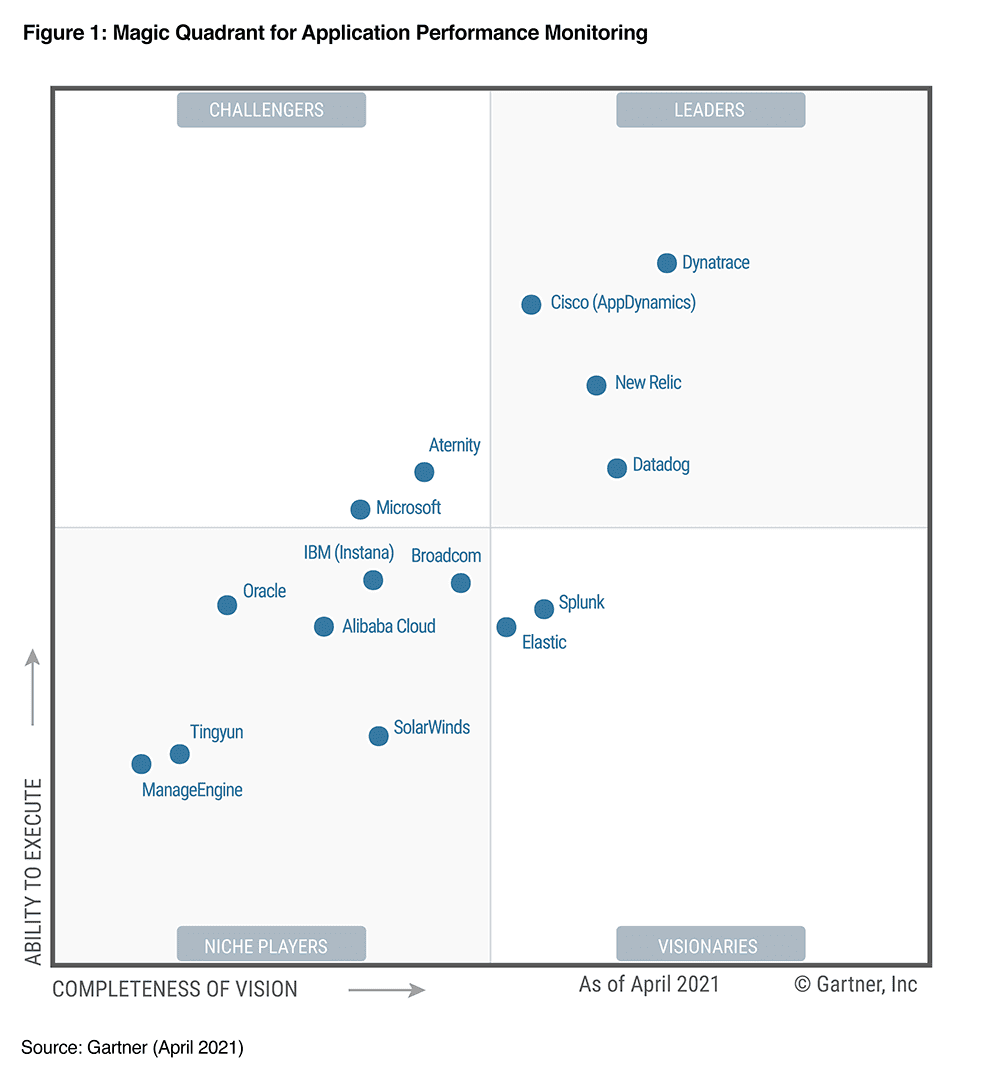
The system's observability landscape is rich and crowded, as shown below in Gartner's Magic Quadrant for Application Performance Monitoring in 2021 below.
The Rise Data Observability
With the advent of the Modern Data Stack, more and more organizations are building ever-complex complex data pipelines moving data from one part of the organization to another. Increasingly, applications themselves are becoming more and more data-driven, relying on real-time data analytics. Maintaining uptime for data pipelines is essential, with every app eventually becoming a data app.
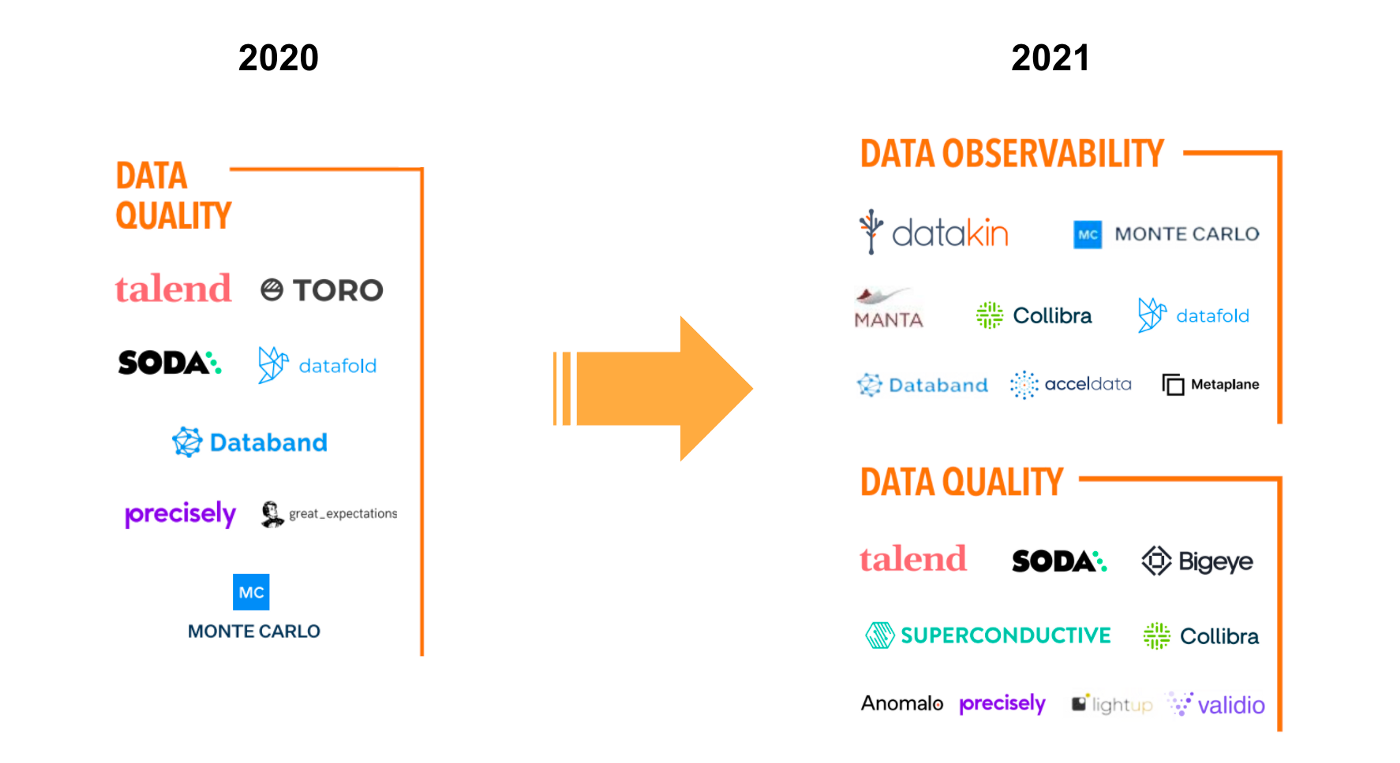
This has led to a surge in the number of companies that have emerged over the past few years, bringing observability to data quality.
These platforms allow you to monitor the most important Data Quality KPIs across the data pipeline and diagnose the root cause of any changes to these Data Quality KPIs via offering Data Lineage as a solution.
Some of the most prominent data quality KPIs are Consistency, Completeness, Orderliness, Timeliness, Accuracy, Auditability, Uniqueness.
The leading companies in the space are Monte Carlo, Accel Data, Data Band, Collibra.
Business Observability - The final frontier of Full Stack Observability
System's observability evolved more from application monitoring and hence has always been siloed from a business context. The end-users are system engineers who use these tools to observe a system's health. However, increasingly the lack of business context awareness and inability to assign business impact due to system downtimes has led to more and more frustration among business leaders.
This is forcing more and more APM companies like AppDyanmics (now owned by Cisco) and Datadog to explore business observability as their next frontier. However, they continue to be focused heavily on developer-first use-cases and fail to appeal to the data & business teams.
In addition, new tools have emerged in the Business Intelligence space, which offer a massive upgrade in experience from the static dashboard tools like Tableau, Metabase, Superset, which have long defined the BI space. These new tools often fall within the Augmented Analytics, KPI Observability, or Business Observability space.
In essence, Business Observability overcomes the limitations of traditional visualization dashboards. Business Observability enables Business & Data Teams to perform large-scale monitoring of business KPIs via advanced analytics methods like anomaly detection and offer automated root cause analysis of the change in the KPIs via methods like automated Drill Downs, Correlation with KPIs and events, and causation.
Business Observability Platforms
Business Observability is a relatively new space. Some of the prominent players in the play are:
Chaos Genius: Chaos Genius is an open-source business observability platform that enables businesses to use ML to monitor thousands of business KPIs (like Sales, DAUs, Conversion Rate, Payment Failures, etc.) and performs automated root cause analysis for any deviations. It offers automatic Drill Downs to enable business users to identify the key drivers of change w/o relying on the help of data teams. It also offers Anomaly Detection and a real-time alerting system. See more here.
Amazon Lookout of Metrics: Amazon Lookout for Metrics uses machine learning (ML) to automatically detect and diagnose anomalies (i.e., outliers from the norm) in business and operational data, such as a sudden dip in sales or spike in customer acquisition rates.
Anodot: Anodot offers a closed-source business monitoring tool. It mainly provides Anomaly Detection on selected KPIs. Anodot detects and groups anomalies across silos to help diagnose and fix business incidents in real-time.
ThirdEye: ThirdEye is an open-source project by Linkedin. Linkedin used ThirdEye as its business-wide monitoring tool to monitor site performance, track member growth, understand the adoption of new features, flag sustained attempts to circumvent system security, and many other areas.
It's an exciting time to make data insights your competitive edge and move from BI to Business Observability. Checkout and access our GitHub Repository here.